Stuart Cartledge, Managing Director, Phoenix Portfolios
Market Commentary
The S&P/ASX 300 A-REIT Accumulation Index lost 1.2% over the December quarter, marginally underperforming the broader equity market, with the S&P ASX 300 Index off 0.9%.
With property transaction markets open once more, property fund managers were strong performers in the period. Centuria Capital Group (CNI) was busy expanding its agricultural real estate business. Firstly, its unlisted Centuria Agricultural Fund (CAF) secured the purchase of Australia’s largest hydroponic greenhouse for $168 million. It then acquired agricultural property business Arrow Funds Management adding a further $444 million of agricultural funds to its platform. It finished the quarter up 31.2%. HMC Capital Limited (HMC) showed some signs of stabilisation amongst what has been a challenging year, gaining 24.5% over the quarter, but remaining down 58.6% for the full year. Charter Hall Group (CHC) also showed good momentum, upgrading operating earnings per security (OEPS) guidance by 5.5%, supported by heightened investment activity within its property investment and funds management platform. CHC finished the period 8.6% higher. Somewhat bucking the trend was Goodman Group (GMG) which disappointed some market participants by not upgrading its own earnings guidance and providing no details on new funds management products at its quarterly update. This was somewhat rectified in December, with the announcement of a $14 billion data centre partnership with CPP Investments. GMG closed the quarter down 5.0%.
Retail property owners performed well in the period. Ongoing solid rent growth, supporting by an increasing population and limited new supply is restoring the negotiating power of shopping centre owners. Regional mall owner Scentre Group (SCG) gained ground, adding 2.9%, whilst competitor Vicinity Centres (VCX) rose 1.6%. SCG-managed Carindale Property Trust (CDP) gained 5.6%, as the Lendlease Group (LLC) fund that owns a stake in the Westfield Carindale Shopping Centre appears to be on a trajectory to wind up. Owners of smaller neighbourhood shopping centres also outperformed, with Region Group (RGN) up 1.2% and Charter Hall Retail REIT (CQR) eking out a 0.1% gain.
Office property owners displayed some weakness in the quarter as bifurcation in the rent growth and values of office properties across jurisdictions and class appears to be widening. The cores of the Sydney and Brisbane CBDs appear to be recovering, with investor interest in those areas reemerging. Suburban and secondary locations are finding it more difficult to attract robust bidding and are seeing persistent elevated incentives. Smaller office property owners Centuria Office REIT (COF) and GDI Property Group (GDI) underperformed the market, losing 2.1% and 2.9% respectively. Mirvac Group (MGR) was a laggard, dropping 7.6%, while large cap competitor, Dexus (DXS) only gave up 0.8%.
Long weighted average lease expiry (WALE) property owners were amongst the weakest in the period. This property is particularly sensitive to longer term interest rates. With the Australian 10 Year Government Bond yield increasing from approximately 4.3% to 4.8% over the quarter, it is unsurprising that this property underperformed. Childcare property owners were weakest, facing higher interest rates and negative sentiment towards the sector. Charter Hall Social Infrastructure REIT (CQE) gave up 7.9%, while Arena REIT (ARF) lost 7.0%. It is worth noting that direct market transactions for this type of property appear to remain robust. Owners of petrol station properties fared somewhat better, but still underperformed, with Waypoint REIT (WPR) and Dexus Convenience Retail REIT (DXC) off 4.0% and 4.3% respectively.
Australia’s residential housing market is at an interesting juncture, with chronic undersupply running into ever increasing affordability concerns. Across the period, it appears as if house price momentum has stalled in Sydney and Melbourne, however, continues to march on in Brisbane, Perth and Adelaide. After producing solid returns earlier in the year, residential property developers lost some ground in the period. Peet Limited (PPC) announced the conclusion of its strategic review, with more of an “evolution” than a “revolution” in strategy. It was down 1.0% over the period. Perth-focused Finbar Group Limited (FRI) gave up 4.0%, however has restocked its project pipeline for the coming years. Large cap developer, Stockland (SGP) dropped 4.9%, easing after strong performance earlier in the year.
Market outlook
The listed property provides investors with the opportunity to gain exposure to high quality, institutionally managed, commercial real estate, with projections of solid prospective growth. While share market volatility may be uncomfortable at times, the offset is liquidity, enabling investors to rebalance portfolios without the risk of being trapped in illiquid vehicles.
Property, both listed and unlisted, is a particularly interest rate sensitive sector. In recent years interest rates rose off generational lows, providing a headwind for real estate returns and valuations. The Reserve Bank of Australia has now reduced its Cash Rate Target three times since February 2025, providing a more supportive environment for real estate securities. The August reporting season reflected this, with companies under coverage providing solid updates, valuation growth and an expectation of liquidity returning to the property transaction market. Long term valuations are driven by “normalised” interest costs, meaning the impact of short term hedges maturing is mostly immaterial.
The industrial sub-sector continues to show strong absorption of relatively high levels of supply, aided by the tailwinds of e-commerce growth, the potential onshoring of key manufacturing categories and the decision by many corporates to build some redundancy into supply chains to cope with current disruptions. All of these factors are contributing to ongoing demand for industrial space, albeit the previous period of market rents expanding rapidly appears to have dissipated. Vacancy rates remain near historic lows of around 3% in many markets. While rental growth has recently cooled, construction costs remain elevated, making additions to supply difficult and thereby prolonging conditions.
We remain cognisant of the structural changes occurring in the retail sector with the growing penetration of online sales and the greater importance of experiential offering inside malls. Recent performance of shopping centre owners has however been strong, with consumers showing resilience and share prices moving higher, with some trading at meaningful premiums to net tangible asset backing. Importantly, we are also now seeing positive re-leasing spreads in shopping centres, indicating strengthening demand from retail tenants. These outcomes are no doubt aided by minimal vacancy across retail portfolios.
The jury is still out on exactly how tenants will use office space moving forward, but demand for good quality, well located space remains solid and there is growing momentum from companies to get staff back into the office. Leasing activity is beginning to pick up, and transactional activity is also returning, with discounts to book values materially reduced. Incentives on new leases remain elevated. At this stage demand for office space appears to be highly variable depending on location, even within submarkets.
We expect to see limited further downside to asset values in office markets but elsewhere expect market rent growth to drive valuations higher as capitalisation rates appear to have stabilised. Listed securities provides exposure to such growth.
The content above is taken from the Cromwell Phoenix Property Securities Fund quarterly report. Sign up here to be the first to access the latest report and to gain a deeper insight into the Fund’s performance.
Performance commentary
Fill out the form below to view the full commentary.
As was often the case over 2025, geopolitics continue to cloud the economic outlook, with the U.S. military operation in Venezuela on 3 January the latest example. Financial markets have largely been unaffected to date, reflecting Venezuela accounting for less than 1 per cent of global oil production (despite holding the world’s largest reserves)1. However, the longer-term implications remain unclear, and subsequent comments regarding the future of Greenland’s sovereignty have added to uncertainty. While the direct implications for Australian real estate are limited, second-round effects could emerge through lower global growth, heightened market volatility, exchange rate movements, and any resulting shift in the inflation outlook – particularly if the U.S. dollar’s safe haven status were to diminish.
On the inflation front, CPI continued to print higher than expected over the final months of 2025. This data saw cash rate expectations shift, with the market pricing 45bps of hikes in 2026 as at 2 January2. The most recent CPI data, released 7 January, showed the pace of annual inflation slowing from 3.8% (October) to 3.4% (November)3, an outcome which was below market expectations (3.6%). While the moderation was welcome and slightly tempered both market expectations for rate hikes and long-term bond yields, it was largely driven by volatile categories such as electricity and holiday travel. Underlying price pressures remain, and the RBA will likely want to see several periods of downwards trend before considering the prospect of rate cuts.
Beyond inflation, cooling house prices and auction clearance rates may provide some confidence that current monetary policy settings are restrictive, but it is the labour market which will carry the greatest weight in the RBA’s deliberations. The unemployment rate has been steady at around 4.3% for the past six months4, but job vacancies, underemployment, and hours worked indicators do suggest conditions are slowly becoming less tight. Both the Labour Force (22 January) and CPI (28 January) data releases will be critical in guiding whether the RBA is likely to remain on hold or hike at its next meeting in early February – economists are currently split, with two of the major banks expecting no change and two expecting a 25bps increase to the cash rate.
Net demand was positive for the eighth consecutive quarter, with occupied space increasing by nearly 44,000 square metres across the major CBD markets in the final three months of 2025. Sydney CBD recorded the strongest increase in net demand for the third consecutive quarter on a square metre basis. Australia’s largest office market benefitted from strong A-grade net absorption, with large financial and professional services occupiers leasing space across several buildings in the Midtown precinct. On a percentage basis, Adelaide CBD was the top-performing market with occupied stock increasing by 1.0%, also driven by large occupiers. Canberra was the only major market to record a contraction of occupied stock over the quarter, due to the consolidation of a federal government department’s office footprint. The rankings and performance of the major CBD markets in the final quarter were consistent with the results recorded on an annual basis over 2025.
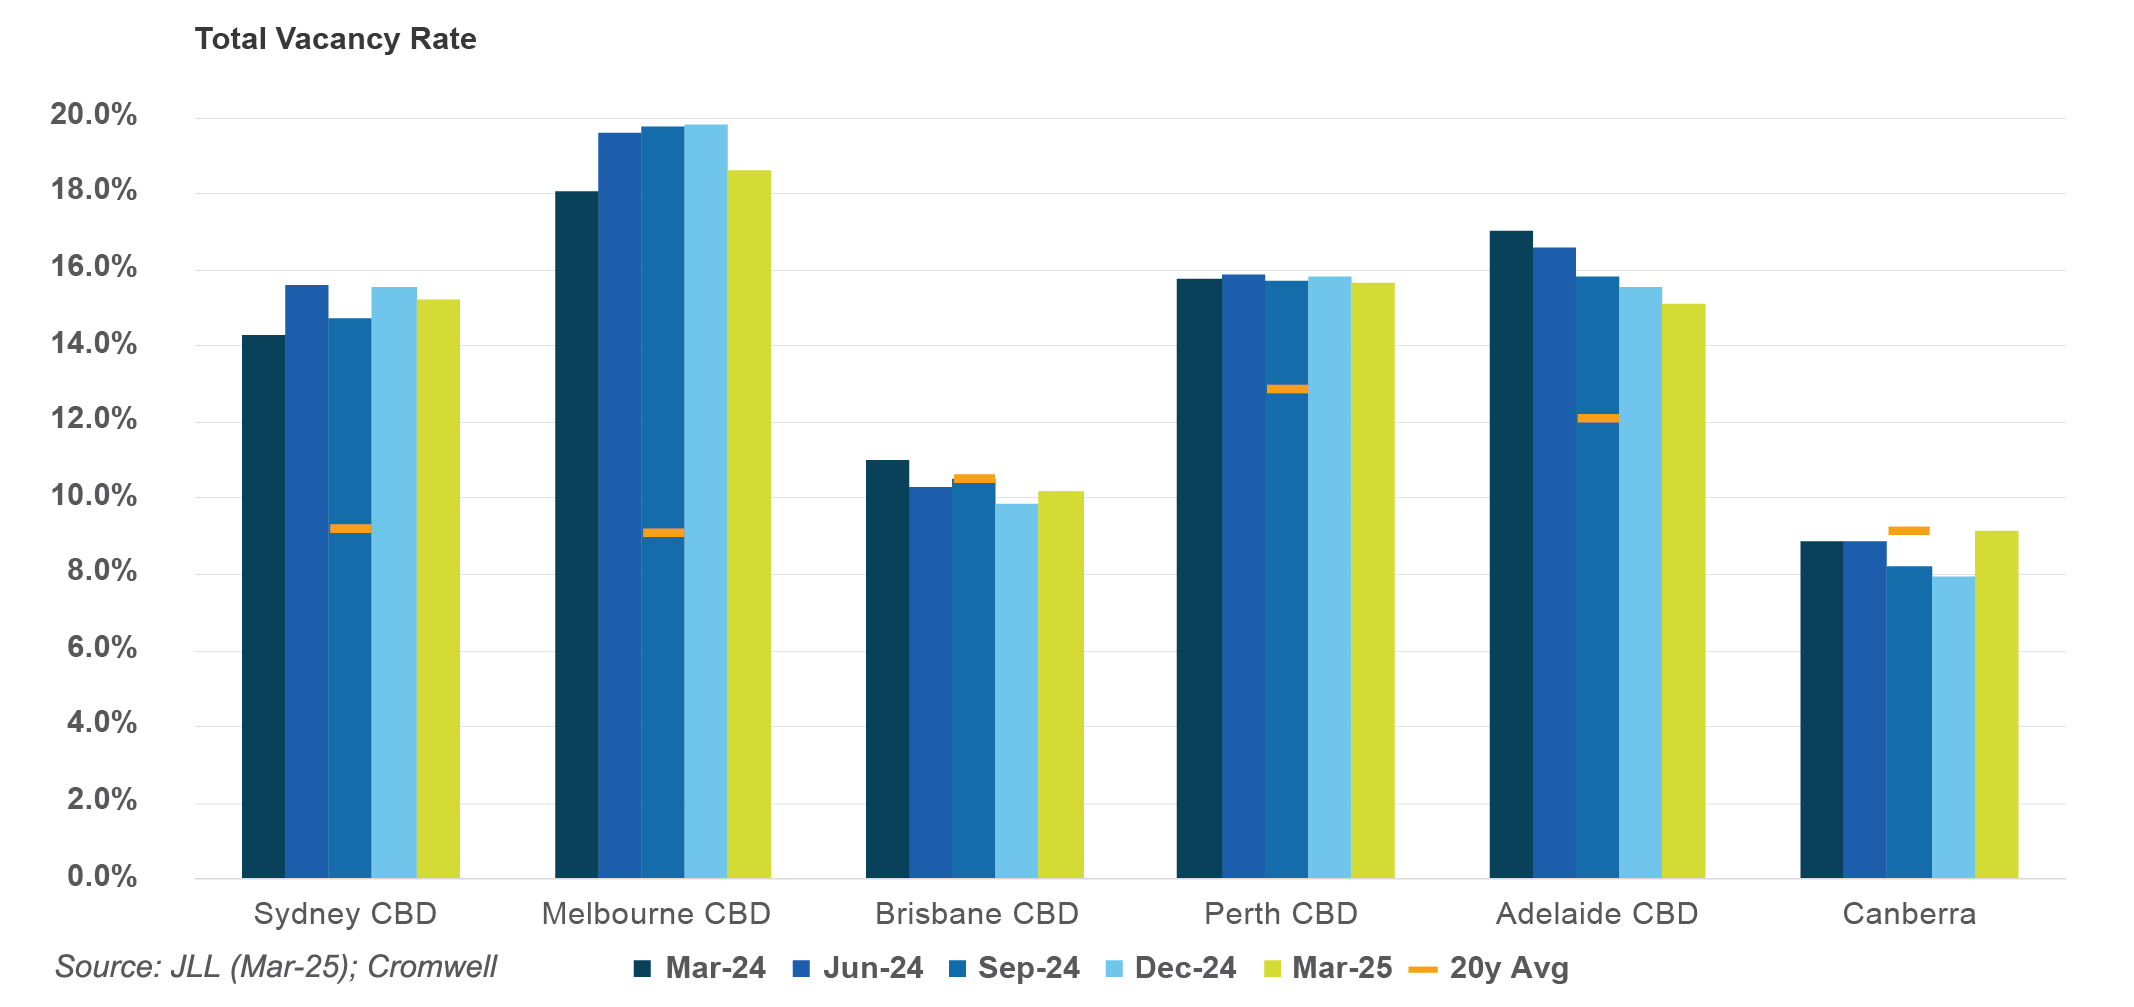
The national CBD vacancy rate was unchanged over the quarter as new supply completions offset higher net demand. Adelaide CBD vacancy decreased from 15.7% to 14.9% reflecting the strong leasing performance over the quarter and an unchanged total stock level. Brisbane CBD saw the biggest increase in vacancy rate (+1.0%), as a partially vacant new Premium building reached completion. While Brisbane CBD vacancy has increased over the last two quarters, it has not been due to shrinking demand but rather the biggest calendar year of supply since 2012. Positively, no supply is expected to be added to the Brisbane CBD market in 2026, which in our opinion will put downwards pressure on vacancy and be supportive of rental growth.
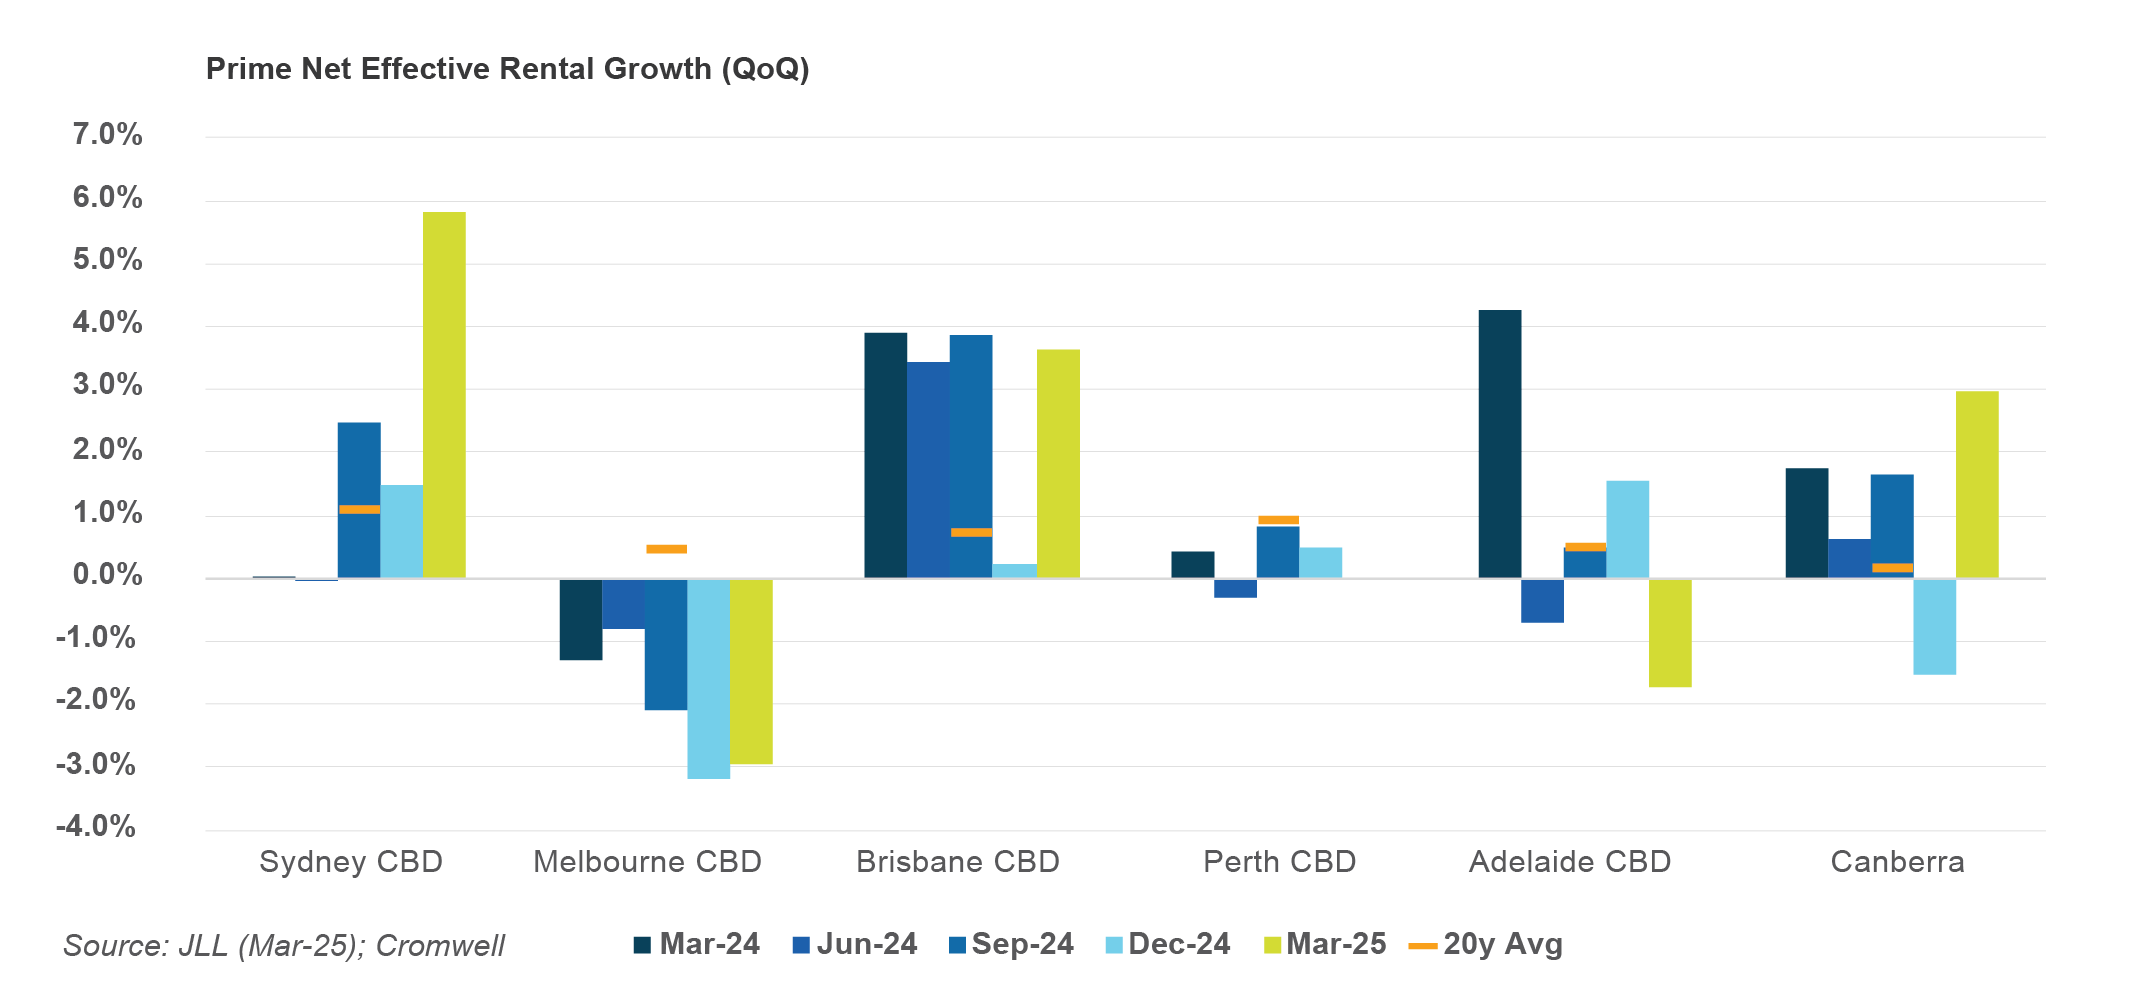
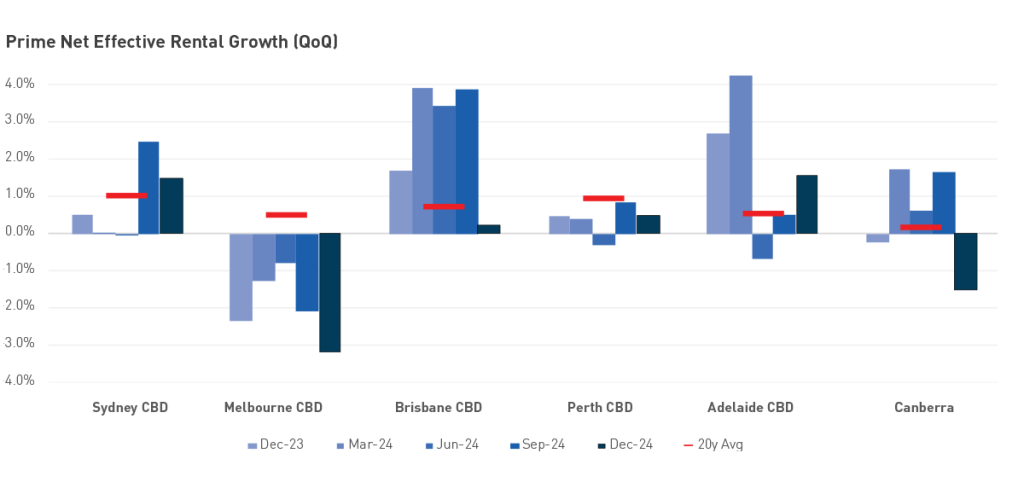
National CBD prime net face rent growth accelerated to +1.5% for the quarter and +6.3% for the calendar year, the strongest pace of annual growth in eight years. Brisbane CBD led the way with quarterly growth of +2.6%, duly supported by Canberra and Sydney CBD. On an annual basis, the pace of growth accelerated in every major market except the Perth and Adelaide CBDs. Prime incentives were largely unchanged over the quarter, Brisbane CBD the exception with a decrease of 80bps. This improvement drove a strong outcome in Australia’s top-performing office market, with Brisbane CBD annual prime net effective rent growth hitting double digits for the 10th consecutive quarter. Prime rent growth continues to outperform rent growth across lower quality assets.
National office transaction volume exceeded $4 billion over the final three months of 2025, representing the strongest quarter of dealmaking since interest rate hikes put the brakes on real estate liquidity in 2022. Activity was headlined by Commonwealth Superannuation Corporation taking full control of Grosvenor Place (Sydney CBD), and GPT’s subsequent acquisition of 50% of the asset. Brisbane and Canberra also recorded transaction volume greater than the 10-year average, with Brisbane’s figures driven by a recovery in the number of deals. Average prime yields were unchanged in every major market except Melbourne CBD, which saw a small expansion over the quarter.
Improving household wealth and income have continued to flow through to consumption despite consumer sentiment remaining in pessimistic territory. Household Spending Indicator data for October, the most current at time of writing, showed the strongest monthly growth in spending since early 2024 and the strongest annual growth since late 2023. The Clothing and footwear category was the top performer over the month, a positive for Regional shopping centres which have a higher weighting to discretionary consumption. Non-discretionary consumption delivered stronger growth on an annual basis, with spending in the grocery sub-category increasing +7.0% year-on-year6.
A positive demand environment combined with limited new supply led to improvement in retail vacancy rates. Neighbourhoods was the only centre type to record an increase in stock level over the quarter, as four new developments reached completion. Regionals vacancy declined to its lowest level in over ten years, with conditions improving the most along the East Coast. Neighbourhoods vacancy declined to its lowest level in nine years, led by South-East Queensland and Perth. It was a mixed bag for Sub-Regionals, with the vacancy rate over the last six months increasing in Melbourne by 120bps but decreasing in Perth by 190bps.
Net rents were relatively unchanged over the quarter. Sydney and Melbourne Regionals both recorded rising rents for the second consecutive quarter, albeit muted growth of just +0.2%. South-East Queensland remains the top-performing Regional shopping centre market on an annual basis despite being flat over the last three months. It was a similar story in Neighbourhoods, with Sydney recording quarterly growth of +0.2% and Melbourne net rents increasing by +0.3%. No markets recorded net rent growth for Sub-Regional centres.
Retail transaction volume strengthened over the quarter, totalling over $3.5 billion. Regional shopping centres dominated activity, comprising the three largest deals and nearly $1.9 billion of volume. Like last quarter, the largest deal was a 25% stake in the country’s second-largest shopping centre, Westfield Chermside in Brisbane. It was an active quarter for Sub-Regional and Large Format centres as well, with both centre types exceeding their average quarterly volume of the past five and ten years.
There were signs of retail yield compression across the quarter, consistent with stronger deal volume and investor interest. Regional average equivalent yields compressed by 12-13bps in Perth, Adelaide, and Melbourne. For Sub-Regionals, only the lowest (Sydney) and highest (Perth) yield markets were unchanged, with South-East Queensland, Adelaide, and Melbourne all recording compression of 12-19bps. It was a similar story in Neighbourhood centres with South-East Queensland, Melbourne, and Perth yields compressing 7-13bps.
Occupier take-up (gross demand) softened compared to last quarter but remained well above the pre-COVID average. Retail & Wholesale Trade recorded the biggest decrease on a percentage basis, largely due to a slowdown in leasing activity from wholesalers. Manufacturing demand was resilient, exceeding 150,000 square metres, while smaller occupier industries such as Construction, Utilities, and Public Administration continued to record elevated demand relative to trend. From a geographical perspective, Melbourne recorded the most gross take-up at nearly 290,000 square metres. However, it was Perth that was the top-performer, recording its strongest quarter of demand since mid-2015. Perth’s strong outcome was driven by pre-leasing activity at new developments.
While demand is moderating, so too is supply. Just over 540,000 square metres of stock was added to the market in the final quarter, 11% less than the quarterly average over the last five years. Completions for 2025 totalled 2.3 million square metres, the lowest level of supply in a calendar year since 2021. There is currently 2.2 million square metres of supply under construction and due for completion in 2026, with a further 1 million square metres having plans approved or submitted and also scheduled for completion this year. A consistent trend over 2025 was the delay or postponement of projects due to construction and feasibility constraints, and this dynamic looks set to continue.
Prime net rent growth improved slightly on last quarter, averaging +1.0% nationally. Adelaide was the top-performing market as the majority of its precincts recorded rent growth of approximately +3.0% for the quarter. Rent growth was solid in Brisbane but largely flat across Sydney, Melbourne and Perth. Across the East Coast, market rent growth continues to normalise as vacancy rates move back towards long-term averages. Average prime incentives decreased by 250bps in every Perth precinct and were largely unchanged across the other markets, supporting effective rents.
Industrial transaction volume was weak in the final quarter of 2025, driven by a lack of large portfolio deals and limited transaction activity in the two largest markets (Sydney and Melbourne). For the first time in five years, Brisbane was the highest volume market in dollar terms, underpinned by the Southern precinct.
Average prime yields compressed by 12bps across most precincts in Sydney, which maintained its position as Australia’s tightest market. Most Adelaide precincts also recorded compression, ranging from 13-25bps. At the other end of the spectrum, Melbourne yields expanded by 25bps in each of its three major precincts. Anecdotally, confidence and pricing have been impacted by an uncertain policy environment.
Outlook
While the S&P500 has risen to record highs, trade policy uncertainty remains a headwind for stronger investor confidence. The Supreme Court is set to rule imminently on the legality of Trump imposing tariffs using IEEPA powers. Jobs growth and company earnings could benefit from the removal of the tariffs. However, the administration has indicated that other legislative instruments (such as the 1962 Trade Act) will be used to maintain the status quo if the current arrangement is struck down. Geopolitics more broadly will be closely watched, as the implications of the Venezuela operation become clearer. Trump also appears to be laying the groundwork for Greenland negotiations, which could result in the US gaining greater access to the territory’s natural resources (e.g. rare earth minerals). Meanwhile, protests have intensified in Iran, adding another layer of geopolitical risk for markets.
While Australia is not immune from global ructions, it is relatively insulated. The RBA has delivered a “soft landing” to date, but inflation remains elevated and needs to be addressed before expectations become unanchored from the 2-3% target range. This can be achieved with tweaks to monetary policy – rather than wholesale changes – as economic data evolves.
The commercial property market continues to stabilise, with improving sentiment evident in both capital flows and leasing fundamentals. Construction remains prohibitively expensive in most circumstances, crimping development pipelines and supporting the valuation and rent growth outlook for existing assets. Office appears to have reached an inflection point, with valuations improving and institutional and offshore capital becoming more acquisitive, particularly for prime assets. A similar, more progressed story is playing out in retail, as shopping centres at either end of the leisure-convenience spectrum record tightening yields. We see industrial performance becoming more precinct-specific, as greater variance in space market fundamentals emerges across markets and asset types.
Sign up to Insight Magazine
Stay informed about investing strategies, finance news, property market updates, and more by signing up for Insight. Build a solid foundation of investment knowledge to help you make the right investment decisions and guide you in planning your investment journey.
Biodiversity: a fundamental part of our natural capital
Consideration of the environmental impact of real estate is usually focussed on greenhouse gas emissions during construction and operations. However, …
Stuart Cartledge, Managing Director, Phoenix Portfolios
Market Commentary
The S&P/ASX 300 A-REIT Accumulation Index rose 4.8% over the September quarter, marginally underperforming the broader equity market, with the S&P ASX 300 Index returning 5.0%.
Most companies under coverage reported full financial year results to 30 June 2025 during the period. Broadly speaking results were solid. Headwinds of higher interest rates and subsequent asset devaluation appear to be a thing of the past, with forecast finance costs stabilising and valuations growing in line with rent growth. This is resulting in expectations of growth in funds from operations (FFO) and dividends per security moving forward.
The benchmark was dragged lower by Industrial heavyweight Goodman Group (GMG), giving up recent gains due to underwhelming forward guidance presented at its full year result. It closed the quarter 4.3% lower. Alternatively, the more conducive local market environment helped other property fund managers. Both Charter Hall Group (CHC) and Centuria Capital Group (CNI) reported that many of their investment channels are opening, most notably property syndicates sold to retail investors. CHC posted a solid result, with full year funds under management growth driven by capital expenditure and development activity. Moreover, forecast earnings per security growth of 10.6% exceeded expectations. CHC finished the quarter 18.6% higher. Similarly, CNI shook off concerns of a more challenging real estate cycle, with their largest property syndicate yet receiving strong demand. CNI also guided to earnings per security growth of 10%. The company’s share price jumped 31.2% higher in the September quarter.
Owners of shopping centres performed strongly over the period. After facing a more challenging backdrop, shopping centres are now operating in a supportive environment, with lower interest rates translating into consumer confidence and increased spending. Both Scentre Group (SCG) and Vicinity Centres (VCX) showed specialty sales growth that improved through every quarter of the financial year. Both also indicated strong outcomes continued into July and August. SCG gained 17.1%, while VCX rose 4.5%. Both now trade at a premium to net tangible asset backing, a scenario that seemed highly implausible not long ago. Similarly, owners of smaller neighbourhood shopping centres performed well, lifted by similar drivers. Region Group (RGN) added 8.6% and Charter Hall Retail REIT (CQR) finished the period 9.2% higher.
Office property owners mostly performed well in the quarter however performance was somewhat divergent amongst peers. It appears as if capitalisation rates have stabilised, face rents are growing slowly, and incentives have begun to decline. Despite this, most new office leases still require incentives of more than 40% of net rent to be paid, with demand highly varied, even within submarkets. Cromwell Property Group (CMW) led the way, up 36.0%, with a new large shareholder on the register. GPT Group (GPT) and Growthpoint Properties Australia (GOZ) both performed well, gaining 11.0% and 10.3% respectively. Dexus also outperformed the broader market adding 8.0%, in what was a reasonably tumultuous period for its funds management business. Mirvac Group (MGR) lagged the pack but still added 3.2% over the quarter.
Ongoing house price growth around the country supported residential property developers during the period. Perth-based developers performed particularly well, with Finbar Group (FRI) rising 25.7% and Peet Limited (PPC) up 20.6% as financial results and forward outlook for the companies remained strong. Stockland also rose sharply, gaining 14.2%, presenting a rosy outlook for ongoing growth. Aspen Group (APZ) also continued its move higher, benefitting from major index inclusion. It finished the quarter 18.5% higher.
Market outlook
The listed property sector is in good shape and provides investors with the opportunity to gain exposure to high quality, institutionally managed, commercial real estate, with projections of solid prospective growth. While share market volatility may be uncomfortable at times, the offset is liquidity, enabling investors to rebalance portfolios without the risk of being trapped in illiquid vehicles.
Property, both listed and unlisted, is a particularly interest rate sensitive sector. In recent years interest rates rose off generational lows, providing a headwind for real estate returns and valuations. The Reserve Bank of Australia has now reduced its Cash Rate Target three times since February 2025, providing a more supportive environment for real estate securities. The August reporting season reflected this, with companies under coverage providing solid updates, valuation growth and an expectation of liquidity returning to the property transaction market. Long term valuations are driven by “normalised” interest costs, meaning the impact of short-term hedges maturing is mostly immaterial.
The industrial sub-sector continues to show strong absorption of relatively high levels of supply, aided by the tailwinds of e-commerce growth, the potential onshoring of key manufacturing categories and the decision by many corporates to build some redundancy into supply chains to cope with current disruptions. All of these factors are contributing to ongoing demand for industrial space, albeit the previous period of market rents expanding rapidly appears to have dissipated. Vacancy rates remain near historic lows of around 2% in many markets. While rental growth has recently cooled, construction costs remain elevated, making additions to supply difficult and thereby prolonging conditions.
We remain cognisant of the structural changes occurring in the Retail sector with the growing penetration of online sales and the greater importance of experiential offering inside malls. Recent performance of shopping centre owners has however been strong, with consumers showing resilience and share prices moving higher, with some trading at meaningful premiums to net tangible asset backing. Importantly, we are also now seeing positive re-leasing spreads in shopping centres, indicating strengthening demand from retail tenants. These outcomes are no doubt aided by minimal vacancy across retail portfolios.
The jury is still out on exactly how tenants will use office space moving forward, but demand for good quality, well located space remains solid and there is growing momentum from companies to get staff back into the office. Leasing activity is beginning to pick up, and transactional activity is also returning, with discounts to book values materially reduced. Incentives on new leases remain elevated. At this stage demand for office space appears to be highly variable depending on location, even within submarkets.
We expect to see limited further downside to asset values in office markets but elsewhere expect market rent growth to drive valuations higher as capitalisation rates appear to have stabilised. Listed securities provides exposure to such growth.
The content above is taken from the Cromwell Phoenix Property Securities Fund quarterly report. Sign up here to be the first to access the latest report and to gain a deeper insight into the Fund’s performance.
Performance commentary
Fill out the form below to view the full commentary.
Political uncertainty in the US was a defining theme over the last quarter, and it came to a head on October 1st as funding lapsed and the Federal government shut down, fuelling uncertainty over fiscal discipline and delaying key economic data releases. The shutdown became the longest in history, ending on November 12th after 43 days of disruption. As expected, the episode had limited impact on Australia.
Back home, a number of data prints indicated inflation and growth are both running a touch hotter than expected. The September quarterly CPI increased to 3.2% on a 12-month basis1, rising above the upper bound of the RBA’s target band. While the result was skewed higher by some volatile items like fuel, and administered prices such as utilities and property rates, the breadth of categories running above 3.5% year-on-year suggests some inflationary pressures remain in the domestic economy.
While households’ financial position has been improving, rising cautiousness and a greater degree of saving (rather than spending) threatened to dampen Australia’s economic growth recovery. Those concerns were somewhat allayed by the latest print of the Westpac-Melbourne Institute Consumer Sentiment index which surged by +12.8% to 103.8, marking the first time it has sat in positive territory since early 20222.
Similarly, the unemployment rate fell from 4.5% to 4.3% in October, unwinding the increase seen in the previous month. The result was underpinned by the creation of 55,300 full-time jobs and an unchanged participation rate3. The RBA would have likely welcomed the outcome, which helps avoid the tension that would come with a deteriorating labour market at a time of sticky inflation.
Following the latest data releases, markets now believe the RBA’s easing cycle has concluded, with no further cuts priced in over the forecast horizon4. Economists largely agree, however some forecasters still expect a rate cut in the first half of 2026.
Taken together, economic data suggests Australia is on track and in a better position than most countries. The key question is whether the RBA will leave monetary policy settings in restrictive territory for too long, however the Board is cognisant of the risk and will be guided by the data.
The office sector’s gradual recovery continued, with net demand for space expanding by nearly 57,000 square metres (sqm) over the quarter. Sydney CBD again saw the biggest absolute increase in demand (36,000 sqm), while the 25,000 sqm of net absorption recorded in Brisbane CBD represented the strongest growth on a percentage basis. Sydney’s demand was led by prime stock and the Western Corridor, a precinct which struggled through the pandemic but is now attracting tenants centralising from other markets (particularly north of the bridge). Brisbane’s strong quarter was more broad-based, with occupied stock increasing across the quality spectrum. Occupied space contracted in Canberra, the worst performing market over the quarter, largely due to the consolidation of a federal government department.
Despite the positive demand result, the national CBD vacancy rate edged +0.1% higher to 15.1% due to weakening conditions in lower quality stock. Sydney was the only CBD market to record a decrease in vacancy rate, underpinned by the absence of development completions over the quarter. Four projects were brought to market in Melbourne CBD and pushed the vacancy rate up +0.4%, however it remains below the peak seen in December 2024. Adelaide saw the largest increase in vacancy as 50 Franklin St reached completion with space still unleased.
National CBD prime net face rent growth maintained its strong pace, increasing +1.2% over the quarter and +5.9% over the 12 months to September. Canberra recorded the strongest growth over the quarter despite its softening vacancy rate – there is significant variance in this market as tenants prioritise higher quality premises with strong ESG credentials in specific precincts. Growth in Brisbane CBD also continued at pace, reflecting favourable leasing conditions. Prime incentives increased slightly in Canberra, consistent with the shift to newly developed premises, but remained relatively unchanged across the other markets. The combination of solid face rent growth and stable incentives contributed to higher rents on an effective (incentive-adjusted) basis. This was the first quarter since June 2022 where net effective rents increased in all the major CBD markets.
Office transaction volume strengthened over the quarter to $1.3 billion, but this level remains below the long-term average. The biggest recovery was recorded in Melbourne, which was the top-performing market (by dollar volume) for the first time since September 2022. Similar to last quarter, a lack of large deals dampened the national volume figure. There was further evidence that the office valuation cycle is at, or close to, the bottom, with average prime yields unchanged in every CBD market.
The ABS ceased publication of the Retail Trade series after the June release. While this reduces the granularity of retail data available, the Household Spending Indicator series still provides a solid read on consumer activity. Supportive conditions maintained the pace of spending growth over the quarter. Groceries continued to record stronger growth than discretionary categories, such as Clothing, while the mining states of Western Australia and Queensland continued to outperform New South Wales and Victoria.
Supply remains very constrained, particularly at the “big end of town”. There was no Regional shopping centre stock added for the fifth consecutive quarter, while a single Sub-Regional centre reached completion. Development of Neighbourhood centres is more pronounced, with annual stock growth running at 1.3% as at September. However, this is consistent with the delivery of new centres in population growth corridors and is still less than half the rate of growth averaged over the last 20 years.
This lack of supply is contributing to solid rent growth. On a net basis, Regional rents have grown 0.9% over the past year, outpacing Sub-Regionals and Neighbourhoods. Similar to office, Sydney and South-East Queensland recorded the strongest retail rent growth over the quarter.
It was another solid quarter of retail transaction activity with dollar volume totalling over $2.1 billion. The result was underpinned by Regional centres, as partial stakes in Bankstown Central and Westfield Chermside changed hands. Large Format activity was also elevated, headlined by the portfolio sale of six Bunnings assets by Wesfarmers. Neighbourhood centres saw slightly less activity than normal, while no Sub-Regional or CBD assets transacted. There was a moderate level of yield compression recorded over the quarter, led by Sydney which is typically the bellwether market for capital. Neighbourhoods tightened the most nationally, as investors continue to be attracted to convenience assets aligned to non-discretionary spending. Perth was the only market where yields were unchanged across every core shopping centre type.
Occupier take-up (gross demand) was largely in line with last quarter, totalling just over 823,000 sqm. Demand for this quarter was less dominated by a single tenant movement, with the largest leasing deal comprising just over 36,000 sqm of space. Transport & Warehousing was the main driver of the result with over 300,000 sqm of gross demand recorded, while a pickup in Manufacturing leasing helped offset weaker demand from Retail & Wholesale Trade. On a geographical basis, the result was largely consistent with last quarter – Sydney the most active market followed by Melbourne and Queensland.
Rent growth improved slightly on last quarter, averaging +0.8% nationally over the three months to September. Sydney was the top-performing market, with its Inner West precinct recording the strongest growth nationally (+3.5%) and the Outer Central West precinct also recording robust quarterly growth of +2.0%. Adelaide saw strong growth across its southern precincts and remains the top-performing market on an annual basis. Prime incentives increased in every Melbourne precinct, dragging effective rents lower, but were largely unchanged across the rest of the markets.
Delivery of new supply almost halved compared to last quarter, with less than 414,000 sqm of space brought to market nationally. This was the lowest quarter of supply since March 2023 and the most muted 3rd quarter since 2021, with limited completions in Brisbane and a lack of large projects the key drivers. Sydney and Melbourne accounted for 79% of supply over the quarter, a greater proportion than is typical. There is currently nearly 750,000 sqm of space under construction and due to complete in 2025, however, actual delivery may slip into subsequent periods given construction delays are persisting.
Industrial transaction volume strengthened further over the quarter, totalling nearly $3.5 billion across 102 deals. This was the highest number of deals conducted in a quarter since the data series commenced. Sydney and Brisbane were the standout markets, accounting for 60% of dollar transaction volume. The largest transaction of the quarter was Goodman’s acquisition of a 196-hectare site near the under-construction Western Sydney International Airport for around $575 million. While capital continues to prioritise Sydney, Perth was the market which saw the largest compression in yields (-25bps in every submarket). Brisbane also continues to be viewed favourably, with yields compressing in every submarket by 13-20 basis points.
Sign up to Insight Magazine
Stay informed about investing strategies, finance news, property market updates, and more by signing up for Insight. Build a solid foundation of investment knowledge to help you make the right investment decisions and guide you in planning your investment journey.
Trade policy uncertainty remains a headwind for investor confidence. While the global economy is gradually adapting to the current tariff settings, lower courts have ruled the measures illegal. The Supreme Court is set to hear the case from 5th November, with a final ruling likely in early 2026. If the Court upholds the lower-court decisions, the Trump Administration is expected to explore alternative legal avenues to re-establish the tariffs. In practice, the near-term economic impact may be limited, but the ongoing legal and policy uncertainty is likely to keep risk sentiment cautious until the issue is resolved.
Australia is somewhat insulated from the impacts of global volatility, including the most recent tit-for-tat escalations between the US and China. The key considerations domestically are the trajectory of services inflation and the willingness of the RBA to step in and stimulate activity if the labour market deteriorates more quickly. The economy is beginning to transition from public-led growth to private sector investment, but a more supportive monetary environment may be required to maintain momentum.
The commercial property market continues to stabilise, with improving sentiment evident in both capital flows and leasing fundamentals. Construction remains prohibitively expensive in most circumstances, cramping development pipelines and supporting the outlook for existing assets. Office appears to have reached an inflection point, while retail and industrial pricing continues to firm. As confidence returns to the asset class and institutional capital re-engages, identifying compelling opportunities will increasingly depend on a deep understanding of asset quality and positioning.
Footnotes
Cromwell analysis of ABS data (Nov-25)
Westpac-Melbourne Institute (Nov-25)
ABS (Nov-25)
ASX (Nov-25)
Related posts
December 2024 quarter ASX A-REIT market update
The S&P/ASX 300 A-REIT Accumulation Index gave back some of the gains seen in the previous quarter, dropping 6.1%. Property stocks underperformed …
Stuart Cartledge, Managing Director, Phoenix Portfolios
Market Commentary
The S&P/ASX 300 A-REIT Accumulation Index rose 13.4% over the June quarter outperforming the broader equity market, despite the S&P ASX 300 Index returning a creditable 9.5%. During the period, many of the global macroeconomic and geopolitical fears that were gripping the market somewhat dissipated, at least in terms of stock market returns.
The benchmark is dominated by Industrial heavyweight Goodman Group (GMG), which recovered strongly over the quarter, closing 21.0% higher, almost recovering to where it began 2025. The more conducive market environment also helped other property fund managers. Qualitas Limited (QAL), led the way, gaining 45.6%, despite limited company specific news. Solid residential house price growth is supportive of QAL’s business. Charter Hall Group (CHC) was also an outperformer, adding 20.1%. A more stable valuation environment and lowered macroeconomic concerns are a pleasant change for CHC’s business. Alternatively, HMC Capital Limited (HMC) was a meaningful underperformer, losing 18.1%, with ongoing issues across its healthcare property business, due to major tenant, Healthscope’s receivership process, along with a delayed settlement of a key asset that was to seed its Energy Transition business. The CEO of that business also departed HMC. It appears as if this will no longer be the growth driver for HMC, that was once anticipated.
Office property owners were underperformers in the quarter. Recently released external valuations saw limited movement for office properties, with the bulk of portfolios moving within a +/- 2% band. This was characterised by face rent growth offsetting a marginal expansion in capitalisation rates. Mixed rental data however tempered returns. Recent data showed the Melbourne CBD has had the strongest net absorption, but is facing the weakest effective rent growth, with a decline of more than 8% over the past 12 months. These stats were somewhat dominated by Coles planning a move of its head office from its current suburban location to an office building near Southern Cross Railway Station. Absorption numbers were less impressive in Sydney, however effective rents grew 10% over the year, driven by a reduction in incentives. Cromwell Property Group (CMW) lost 6.1% in the quarter, whilst Dexus (DXS) gave up 3.5%. Centuria Office REIT (COF) finished 2.2% higher and Perth-exposed GDI Property Group (GDI) rose 3.9%, still meaningfully underperforming the property index.
Shopping centre owners rose sharply in the June quarter, but still managed to underperform the index. Unibail-Rodamco-Westfield (URW) gained 12.4%, with a positive response to its investor day. Somewhat sadly for local investors, URW announced it would delist from the ASX. After a multigenerational run, this marks the end of offshore Westfield-branded shopping centres’ association with Australia. Locally, Vicinity Centres (VCX) moved 12.3% higher and domestic Westfield shopping centre owner Scentre Group (SCG) lifted 6.0%. Owners of smaller neighbourhood shopping centres also produced solid returns, with Region Group (RGN) up 9.7% and Charter Hall Retail REIT (CQR) adding 10.7%.
Uniformly positive house price growth around the country supported residential property developers during the period. Cedar Woods Properties Limited (CWP) jumped 36.6% higher, as it upgraded full year earnings guidance and restocked it land bank. Peet Limited (PPC) also outperformed, gaining 19.7%, supported by the announcement of a strategic review process. AV Jennings Limited (AVJ) rose 9.9% as it heads towards completion of its takeover. Finbar Group Limited (FRI) underperformed the index, up 0.7%, as its previously announced CEO transition occurred in June.
Market outlook
The listed property sector is in good shape and provides investors with the opportunity to gain exposure to high quality commercial real estate at a discount to independently assessed values. While share market volatility may be uncomfortable at times, the offset is liquidity, enabling investors to rebalance portfolios without the risk of being trapped in illiquid vehicles.
Rising interest rates have been a headwind for many asset classes, with property, both listed and unlisted, a particularly interest rate sensitive sector. In February, the Reserve Bank of Australia made its first cut to the cash rate target since November 2020, heralding a more buoyant environment for the property sector. The February reporting season also saw stocks providing solid updates, valuation stability and an expectation of liquidity returning to the property transaction market. Long term valuations are driven by “normalised” interest costs, meaning the impact of short term hedges maturing is mostly immaterial. A second 25bp interest rate cut was delivered in May 2025. Should current expectations for further interest rate cuts eventuate, the sector should perform well.
The industrial sub-sector continues to be the most sought after, given the tailwinds of e-commerce growth, the potential onshoring of key manufacturing categories and the decision by many corporates to build some redundancy into supply chains to cope with current disruptions. All of these factors are contributing to ongoing demand for industrial space, which has been evidenced by rapidly accelerating market rents and vacancy rates at historic lows of around 2% in many markets. While rental growth has recently cooled, construction costs remain elevated making additions to supply difficult and thereby prolonging robust conditions.
We remain cognisant of the structural changes occurring in the Retail sector with the growing penetration of online sales and the greater importance of experiential offering inside malls. Recent performance of shopping centre owners has however been strong, with consumers showing resilience and share prices moving higher. It is interesting to note the juxtaposition of very high retail sales figures despite very low levels of consumer confidence, no doubt impacted by rising costs of living. Importantly, we are also now seeing positive re-leasing spreads in shopping centres, indicating strengthening demand from retail tenants.
The jury is still out on exactly how tenants will use office space moving forward, but demand for good quality well located space remains solid and there is growing momentum from companies to get staff back into the office. Leasing activity is beginning to pick up, and transactional activity is also returning, with discounts to book values materially reduced. Incentives on new leases remain elevated.
We expect to see limited further downside to asset values in office markets but elsewhere expect market rent growth to largely offset cap rate expansion, particularly in industrial assets. Listed pricing provides a buffer to such movements.
The content above is taken from the Cromwell Phoenix Property Securities Fund quarterly report. Sign up here to be the first to access the latest report and to gain a deeper insight into the Fund’s performance.
Performance commentary
Fill out the form below to view the full commentary.
The June quarter was notable for its geopolitical instability, headlined by Israel’s strikes on Iran and the subsequent involvement of the US. While Iran’s parliament voted to close the Strait of Hormuz and impede oil supplies in retaliation, the closure has not been enforced, and Brent Crude prices are only 4% higher than a month ago1 . Tensions have cooled to some degree and economic implications have been limited, however the situation could deteriorate and affect economic growth and/or inflation in the months and quarters ahead.
The other most newsworthy events, since our last market update, occurred after the completion of the June quarter – the RBA’s July rate decision and Trump’s ‘Liberation Day 2.0’. A cautious RBA elected to adopt a “wait and see” approach, going against market pricing and economists’ expectations to keep the cash rate steady at 3.85% in a split vote (6:3). The Monetary Policy Board wanted to see more evidence that inflation is likely to stay within the target band – namely June quarter CPI (released 30 July) and June employment data (17 July). These data points will be released prior to the next RBA decision in August and, absent a shock outcome, are expected to pave the way for the third cut of 2025. The market is now expecting 64bps of cuts over the remainder of the year2.
In its decision statement, the RBA flagged elevated global uncertainty and the unknown final scope of US tariffs and associated policy responses – on this front, there has been little respite. Reciprocal tariff rates were set to come into force on 8 July (US time) following a 90-day suspension, however the pause was extended until 1 August. Adding to the complexity, Trump proposed several new tariffs in early July including a 50% tariff on copper imports, 200% on pharmaceuticals from countries with “unfair” pricing mechanisms, and 50% on all imports from Brazil. These measures do not distinguish between ally or foe, and while the announcements may be negotiating bluster, the resulting uncertainty further diminishes confidence in the US as a stable and reliable investment destination. Fortunately, the RBA has plenty of capacity to stimulate the Australian economy if this global uncertainty leads to softer domestic growth.
Fortunately, the RBA has plenty of capacity to stimulate the Australian economy if this global uncertainty leads to softer domestic growth.
Office
Analysis of JLL Research data indicates nearly 57,000 square metres (sqm) of positive net absorption was recorded across Australia’s major CBD markets in Q2 2025, marking the first quarter since 2021 where all markets saw demand for space grow. National CBD office demand has now been in positive territory for 11 of the past 12 quarters. Sydney CBD was comfortably the top performing market from a demand perspective, with 23,500 sqm of net absorption and 92,400 sqm over the last 12 months. Melbourne’s CBD benefitted from tenants centralising from Fringe markets, while the Brisbane CBD saw a number of large occupiers expand their footprint.
Despite the positive demand result, the national CBD vacancy rate edged 0.1% higher to 15.0% due to supply completions. Perth CBD saw the largest increase in total stock following Cbus/Brookfield’s completion of the premium development ‘Nine The Esplanade’. The rest of the increase in supply largely came from the Sydney CBD market, where a major refurbishment in Circular Quay and a luxury mixed use development were completed. While the vacancy rate increased in these two markets, the Brisbane and Adelaide CBDs both saw a tightening of 0.3% pts. In Canberra, the vacancy rate continues to vary significantly by precinct.
National CBD prime net face rent growth maintained its strong pace (+1.4%), taking annual growth to +6.0%. Brisbane recorded the strongest growth, reflecting the market’s low vacancy rate. Performance was also strong in the Melbourne CBD, where headline rents saw the biggest quarterly jump since 2019. Prime incentives were largely unchanged across all of the CBD markets, with Brisbane CBD (-0.3% pts) and Canberra (+0.3% pts) seeing the biggest movements. This resulted in effective rents – headline rents adjusted for incentives – growing most strongly in Brisbane and Melbourne.
Transaction volume fell to $0.9 billion for the quarter, representing the second-lowest June quarter result since the start of the data series (2007). The weak volume figure was due to a lack of major assets changing hands – the largest transaction this quarter was c$290 million, compared to more than $600 million last quarter. However, on a number of deals basis, this quarter saw more activity than last quarter. From a market perspective, Sydney CBD comprised the greatest share of national volume, while the Brisbane Fringe was the only market where volume exceeded the 10-year average.
There was further evidence that the office valuation cycle is at, or close to, the bottom. Average prime yields were unchanged in every CBD market except Brisbane, where a slight expansion of 6.5bps was recorded.
Getting a read on the strength of the consumer has become more challenging over recent months, with Cyclone Alfred (March), and the unusual timing of the Easter/Anzac Day long weekends both introducing some noise in the data. Purchases of winter clothing supported growth in the most recent monthly data (May), however the pace of growth continues to lag expectations. With the RBA choosing to remain on hold, the drag of consumer pessimism may persist a while longer.
Positively for retail real estate, the biannual vacancy rate was largely unchanged over the last six months. Regional shopping centres saw vacancy decrease from 1.6% to 1.5%, while Neighbourhoods saw a significant decrease of 0.8% pts from December to June. These improvements were offset by a large increase in vacancy rate across the Sub-Regional centre type. From a market perspective, conditions tightened across every centre type in Sydney, while Melbourne was the main driver of higher Sub-Regional vacancy.
Supply remains muted with only 13,600 sqm of Neighbourhood space added to national core retail stock over the quarter. The limited supply pipeline is supporting retail fundamentals, however rents were largely unchanged over the latest quarter. On an annual basis, growth has been strongest in S.E. Queensland.
Retail transaction volume strengthened again over the quarter to total $2.4 billion. The resulted was buoyed by the Neighbourhood sub-sector which recorded its second biggest quarter of deal volume in history at just over $860 million. The elevated volume was skewed by the $450 million sale of St Ives Shopping Village, an unusually large transaction which included some adjoining residential properties and presents development potential. Large Format Retail continued to record elevated deal volume, with significant single tenant assets such as IKEA, Costco, and Bunnings, comprising the majority of this quarter’s activity.
Sub-Regional yields compressed across every market except S.E. Queensland. This centre type has seen the biggest recovery in yields since pandemic highs, and pricing is now approaching pre-COVID levels. Neighbourhood yields also decreased in Perth, while there was no movement across the Regional shopping centre type.
Occupier take-up (gross demand) was in line with last quarter at nearly 800,000 sqm. Transport & Warehousing was the main driver of the result with over 300,000 sqm of gross demand recorded. It was also a solid result across Retail & Wholesale Trade, with demand underpinned by Kmart’s preleasing of a new major distribution centre at Sydney’s Moorebank Intermodal Precinct. This leasing deal contributed to Sydney demand outpacing its five-year average and comprising nearly 40% of national take-up. Perth was the only other market to outperform recent history, with a number of occupiers expanding into larger premises.
Rent growth slowed significantly over the quarter with 16 of 22 markets staying unchanged compared to March. All precincts across Sydney and Perth were flat, while the South East was the only sub-market in Melbourne where rents grew (+0.6%). Adelaide also only had one precinct record growth, the Outer North, which was the top performer nationally (+3.3%). Adelaide has comfortably been the top performing market over the last 12 months, but it was Brisbane that topped the growth charts in June with average growth across its three precincts rising to 1.8%. There was a slight increase in prime incentives in select markets along the East Coast.
Just over 800,000 sqm of supply was completed over the quarter, around 30% more than the quarterly average of the past five years. While supply was below average in Melbourne and Perth, Adelaide saw its second largest quarter of development in history. There is currently nearly 950,000 sqm of space under construction and due to complete in 2025. Even if all of these projects are delivered on time, 2025 will see the lowest level of new supply since 2021. Additionally, actual delivery may slip into subsequent periods given construction delays are persisting.
Industrial transaction volume strengthened after last quarter’s unusually soft showing, totalling over $2.4 billion across 90 deals. Brisbane was a standout as Chinese e-commerce giant JD.com made its first industrial investment in Australia – the Wacol Logistics Hub – for around $250 million. Adelaide also saw elevated transaction activity with the dollar volume running 33% higher than the quarterly average of the past five years. Strong demand for Brisbane assets was reflected in market yields, which compressed by 12-20bps across its three precincts. Perth saw the largest movement in yields with every precinct compressing 25bps, while Sydney and Adelaide also recorded some instances of compression.
Sign up to Insight Magazine
Stay informed about investing strategies, finance news, property market updates, and more by signing up for Insight. Build a solid foundation of investment knowledge to help you make the right investment decisions and guide you in planning your investment journey.
The global economy moved from alert to alarmed when higher-than-expected tariffs were announced in early April. While the ultimate trajectory of trade policy remains a key uncertainty, market anxiety has eased somewhat in recent months as Trump has signalled a readiness to back down if economic conditions deteriorate too sharply. Economists now expect the worst-case scenarios to be avoided, however growth is forecast to be weaker than if trade destabilisation had not occurred.
Australia is somewhat insulated from the impacts of global volatility. Most attention domestically is focused on the RBA and its willingness to stimulate the economy. Growth green shoots were seen in 2024, but momentum has slowed, particularly in consumer-oriented sectors. If a more supportive monetary policy environment is not delivered soon, the transition of the economy from public sector demand to private business investment may become bumpy.
The commercial property market continues to stabilise, with improving sentiment evident in both capital flows and leasing fundamentals. Office appears to have reached an inflection point, while retail and industrial pricing continues to firm. As confidence returns to the asset class and institutional capital re-engages, identifying compelling opportunities will increasingly depend on a deep understanding of asset quality and positioning.
How did the Cromwell Funds Management fare this quarter?
Cromwell Direct Property Fund (DPF, the Fund)
The entire DPF portfolio underwent a valuation in advance of the Fund’s Liquidity Event. Compared to prior valuations completed between June and October 2024, the six directly held assets fell by 0.60%. Two assets saw an uplift and one remained flat, primarily due to strong rental growth across Queensland markets.
Considering DPF’s partial ownership of Energex House in Brisbane (Cromwell Riverpark Trust), and the ATO building in Dandenong (Cromwell Property Trust 12), the total change was just 0.90%. Energex House remained flat, while the ATO building declined by 13%, attributed to a 1% increase in the capitalisation rate. This adjustment was made by the independent valuer based on comparable sales evidence in the Melbourne office market.
As at 30 June, DPF’s portfolio, now valued at $537.2 million on a look-through basis, is 96.6% occupied with a weighted average lease expiry of 3.4 years.
Most assets within the DPF portfolio are multi-tenanted buildings, with a significant concentration located in Brisbane. In the current market, particularly in Brisbane, we continue to observe strong effective rental growth. The portfolio’s shorter Weighted Average Lease Expiry (WALE) presents a strategic advantage, enabling the Fund to capitalise on rental reversion opportunities as leases expire and are renegotiated.
This staggered lease expiry profile allows space to be progressively repriced to current market rates, supporting earnings growth. Additionally, the shorter WALE provides flexibility to reposition assets and attract higher-paying tenants, further enhancing the portfolio’s income potential and long-term value.
Just under half of the gross passing income is derived from Government and Listed companies or their subsidiaries. Cromwell’s asset management team have negotiated over 10,000sqm of leasing this financial year across 23 transactions, with several larger deals currently in advanced stages of negotiation. The largest completed deals occurred at 545 Queen Street in Brisbane, including a 6-year lease on over 2,100sqm to a new tenant, and a 2-year lease extension on 1,600sqm to an existing Federal Government tenant.
Cromwell Property Trust 12 (C12)
Cromwell Property Trust 12 is nearing the end of its second term in October this year. In September, investors in C12 will receive a Notice of Meeting and Explanatory Memorandum, which will propose an extension of the Fund’s term through to December 2027. The Explanatory Memorandum will contain market data and commentary to help investors decide whether they wish to extend the trust term or take the asset to market. The ATO building remains 99.3% leased, with only minor ground floor vacancy and a WALE of 5.1 years. Since its inception in 2012 with an initial portfolio of three assets, C12 has delivered strong performance. Despite recent valuation adjustments, the Fund has achieved an equity internal rate of return (IRR) of approximately 11.7%, reflecting its long-term success.
Footnotes
Cromwell analysis of MarketWatch data (9 July)
ASX (8 July)
About Cromwell Direct Property Fund
Read more about Cromwell Direct Property Fund, including where to locate the product disclosure statement (PDS) and target market determination (TMD). Investors should consider the PDS and TMD in deciding whether to acquire, or to continue to hold units in the Fund.
The S&P/ASX 300 A-REIT Accumulation Index gave back some of the gains seen in the previous quarter, dropping 6.1%. Property stocks underperformed …
Stuart Cartledge, Managing Director, Phoenix Portfolios
Market Commentary
The S&P/ASX 300 A-REIT Accumulation Index fell 6.6% over the March quarter under-performing the broader equity market, despite all the geopolitical tensions gripping investors’ minds.
The benchmark is dominated by Industrial heavyweight Goodman Group (GMG), which performed poorly over the quarter, closing down just over 20%. For more on GMG, see the Performance Commentary section of the latest quarterly report. Sticking with the Industrial sub-sector, while a very different investment proposition to GMG, recently listed DigiCo REIT, with its focus on digital infrastructure including data centres was also a very weak performer, down 32.6%. There is little doubt around the demand for ever increasing data centre capacity, but we also expect a significant supply response around the world, and like all things technology related, making long term forecasts is difficult. Anchored by more traditional industrial sheds, both Dexus Industria REIT (DXI) and Centuria Industrial REIT (CIP) posted positive returns of 2.0% and 3.6% respectively. CIP comprises 87 high quality assets, located in core urban infill markets and delivered like-for-like income growth of 6.4% for the first half of the 2025 financial year. The stock is benefitting from striking new leases at material premiums to expiring leases. That premium averaged 50% for the 7% of the portfolio that re-leased during the 6 months to December 2024. CIP closed the quarter at a 25% discount to its underlying book value and is well held in the Fund.
Office property owners saw a rebound from the very weak December quarter, with Dexus (DXS) up 6.3%, Centuria Office REIT up 4.6% and Mirvac Group (MGR), which holds an office-heavy investment portfolio up 11.5%. Other office names were more subdued with Abacus Group (ABG) and Cromwell Property Group both posting less than 1% falls. There is growing chatter, along with some fundamental improvements in office metrics, that the turning point in office markets is close. Depending on your perspective, it seems that owners of quality prime assets such as MGR are in the “flight to quality” camp, while owners of a wider range of office assets point to a “flight to value”. Phoenix has a blend of exposures to the office sector but is predominantly in the young and prime end of the market where cashflows look strongest.
Among the larger style shopping centre owners, Unibail-Rodamco-Westfield (URW), which owns Westfield branded centres in the USA, UK and continental Europe rose 10.3%. URW has a December year-end, so the results announced in February were for the full year. Tenant sales were up 4.5% and footfall up 2.6% over the prior year. The company also made a somewhat surprising announcement to retain its exposure to its US assets, having previously indicated a “radical reduction” in that geography. Scentre Group (SCG), owner of the domestic Westfield-branded malls, did less well and posted a small positive return for the quarter. Interestingly, SCG is looking to rezone many of its vacant land sites around its malls, having already received rezoning approval at Westfield Hornsby in Sydney and Westfield Belconnen in Canberra that now provides the opportunity for large scale residential development at both sites. Vicinity Centres (VCX) and Charter Hall Retail REIT produced solid returns over the quarter, up 7.6% and 13.7% respectively.
Property fund managers showed huge variation in outcomes over the quarter. Aside from GMG referred to elsewhere, Qualitas Limited (QAL) which focuses largely on real estate debt products, closed down 12.2%, Centuria Capital closed down 10.4%, while at the other end of the spectrum was Charter Hall Group (CHC) which closed up 12.8%. With asset values stabilising, and strong inflows via the wholesale partnerships channel, CHC upgraded guidance for the full year and now expects to deliver earnings growth of approximately 7%.
Market outlook
The listed property sector is in good shape and provides investors with the opportunity to gain exposure to high quality commercial real estate at a discount to independently assessed values. While share market volatility may be uncomfortable at times, the offset is liquidity, enabling investors to rebalance portfolios without the risk of being trapped in illiquid vehicles.
Rising interest rates have been a headwind for many asset classes, with property, both listed and unlisted, a particularly interest rate sensitive sector. In February, the Reserve Bank of Australia made its first cut to the cash rate target since November 2020, heralding a more buoyant environment for the property sector. The February reporting season also saw stocks providing solid updates, valuation stability and an expectation of liquidity returning to the property transaction market. Long term valuations are driven by “normalised” interest costs, meaning the impact of short term hedges maturing is mostly immaterial. Should current expectations for further interest rate cuts eventuate, the sector should perform well.
The industrial sub-sector continues to be the most sought after, given the tailwinds of e-commerce growth, the potential onshoring of key manufacturing categories and the decision by many corporates to build some redundancy into supply chains to cope with current disruptions. All of these factors are contributing to ongoing demand for industrial space, which has been evidenced by rapidly accelerating market rents and vacancy rates at historic lows of around 2% in many markets. While rental growth has recently cooled, construction costs remain elevated making additions to supply difficult and thereby prolonging robust conditions.
We remain cognisant of the structural changes occurring in the Retail sector with the growing penetration of online sales and the greater importance of experiential offering inside malls. Recent performance of shopping centre owners has however been strong, with consumers showing resilience and share prices moving higher. It is interesting to note the juxtaposition of very high retail sales figures despite very low levels of consumer confidence, no doubt impacted by rising costs of living. Importantly, we are also now seeing positive re-leasing spreads in shopping centres, indicating strengthening demand from retail tenants.
The jury is still out on exactly how tenants will use office space moving forward, but demand for good quality well located space remains solid and there is growing momentum from companies to get staff back into the office. Leasing activity is beginning to pick up, and transactional activity is also returning, with discounts to book values materially reduced. Incentives on new leases remain elevated.
We expect to see limited further downside to asset values in office markets but elsewhere expect market rent growth to largely offset cap rate expansion, particularly in industrial assets. Listed pricing provides a buffer to such movements.
The content above is taken from the Cromwell Phoenix Property Securities Fund quarterly report. Sign up here to be the first to access the latest report and to gain a deeper insight into the Fund’s performance.
Performance commentary
Fill out the form below to view the full commentary.
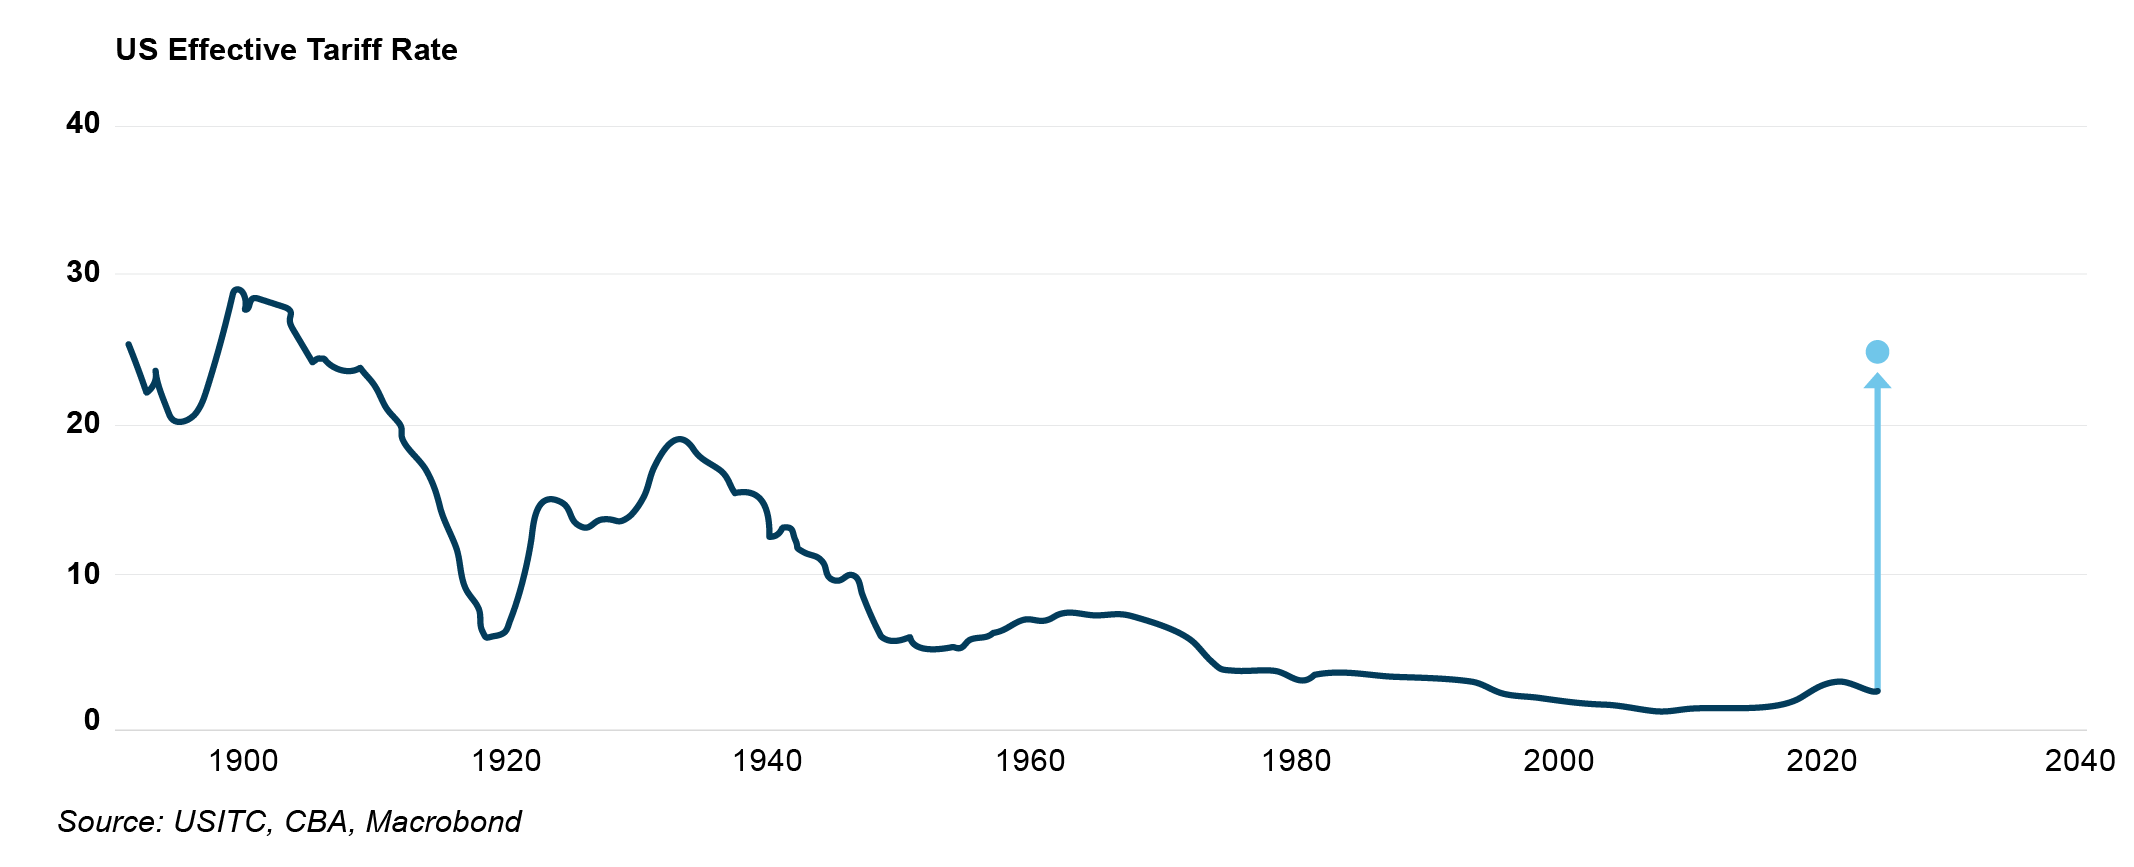
Events of the March quarter have been completely overshadowed by President Trump’s Rose Garden address on 2 April where he announced a universal 10% tariff would be applied to all US imports from 5 April, with higher tariffs to be applied from 9 April against countries with trade surpluses with the US. Taking the measures as announced, the US’s effective tariff rate is expected to increase to around 25%, a level last seen in the early 1900s2.
In the near-term, a key impact to markets and the economy is heightened volatility and uncertainty. Indeed, product exemptions and a 90-day pause on the higher tariff rates (excluding China) have already been announced. While one of Trump’s stated objectives is to incentivise investment into US manufacturing, it will be challenging for companies to commit substantial capital and resources when the landscape could shift significantly by the time these words go to print, let alone the several years which would be required to reorganise supply chains and build facilities.
Equity and bond markets have seesawed as the prospect of stagflation – higher inflation and lower growth – shakes confidence. Positively for Australia, we’re better positioned than most to weather the storm. On the whole, direct trade impacts should be limited given the US only accounts for 4% of Australian exports3. Indirect impacts via a weaker Asian economy are a risk, and the extent of policy support in China will be closely watched. The floating Australian dollar is acting as a shock absorber, depreciating in value and enhancing the attractiveness of our key commodity exports.
Economic conditions at home are also in good shape. The labour market is healthy without being so tight as to cause inflationary wage pressures, the public sector is in a position to provide supportive spending if needed, and the RBA has scope to stimulate the economy via monetary policy. In February, the RBA made its long-awaited first interest rate cut, reducing the official cash rate to 4.1%. Looking ahead, National Australia Bank (NAB) expects further easing, forecasting a 50bps cut in May, followed by 25bps reductions in July, August, and November—potentially taking the cash rate to 2.85% by year-end. Other major banks predict a slightly slower pace, but all anticipate a more supportive interest rate environment, which bodes well for increased transactional activity and continued market recovery.
Looking ahead, National Australia Bank (NAB) expects further easing, forecasting a 50bps cut in May, followed by 25bps reductions in July, August, and November—potentially taking the cash rate to 2.85% by year-end.
Office
Analysis of JLL Research data indicates nearly 44,000 square metres (sqm) of positive net absorption was recorded across Australia’s major CBD markets in Q1 2025, marking the fifth consecutive quarter of space demand growth. The composition of demand was different from previous quarters, with Brisbane CBD the only market to contract and Melbourne CBD the top performer. This was the first time since early 2019 that Melbourne recorded the strongest growth in net demand, with the result underpinned by Coles’ 30,000 sqm centralisation from Hawthorn East into Docklands. Notably, this quarter also saw the largest gap in space demand between large4 and small occupiers nationally since before the pandemic, with large occupiers leading the way. Again, this was underpinned by leasing activity in Melbourne CBD.
The positive demand result and limited supply completions combined to lower the national CBD vacancy rate from 15.2% to 14.9%. Melbourne CBD was the big winner, with vacancy tightening by 1.2%pts. Sydney CBD vacancy also decreased, with every precinct except the Western Corridor tightening. Softer demand over the quarter led to Brisbane CBD’s vacancy rate rising, however it remains lower than the long-term average. The increase in Brisbane was driven entirely by Secondary grade stock – Prime vacancy remained at 7.3% and is below the long-term average, while Secondary vacancy increased by 0.8%pts. Canberra maintained its position as the tightest market in the country, however the vacancy rate did increase due to the completion of a new A grade development.
National CBD prime net face rent growth (+1.9%) accelerated over the quarter, taking annual growth to +5.6% which is its strongest pace since early 2018. While face rents in Perth and Adelaide were unchanged, all of the other CBD markets recorded quarterly growth well in excess of the long-term average. Prime incentives decreased in the Sydney CBD Core as some Premium assets recorded strong leasing outcomes. As a result, Sydney CBD Core delivered its strongest net effective rental growth since 2017 and the best outcome across the major CBDs. Incentives also declined slightly in Brisbane CBD, ensuring effective rental growth stayed in double-digit territory on an annual basis. Elevated vacancy in Melbourne CBD continued to put upwards pressure on incentives, dragging effective rental levels lower.
Transaction volume fell to $1.4 billion after a solid final quarter of 2024. Sydney CBD maintained its position as the top preference for capital, accounting for 73% of activity. Offshore capital was active again, with Japanese investor Daibiru making the largest acquisition of the quarter (135 King St). The trajectory of deal flow in Sydney will be watched closely over coming quarters, given it tends to act as a bellwether for the capital market cycle. Activity in Melbourne was very muted, weighed down by weaker property fundamentals and associated investor cautiousness. Average prime yields were unchanged across every CBD market and most non-CBD markets.
Sign up to Insight Magazine
Stay informed about investing strategies, finance news, property market updates, and more by signing up for Insight. Build a solid foundation of investment knowledge to help you make the right investment decisions and guide you in planning your investment journey.
Retail sales growth has improved from the lows of 2023-24 but is yet to kick up materially. The tailwinds of moderating inflation, lower interest rates, and government cost-of-living supports are competing against a pessimistic and cautious consumer. While confidence was improving through the first quarter of the year, tariff uncertainty has now dampened sentiment.
Amidst stable demand, supply remains very constrained. There were only 13,000 sqm added to national core retail stock over the quarter, comprising two greenfield Neighbourhood centres servicing new housing estates. Muted supply has supported retail space market fundamentals and rental growth over the past year. While rents were largely unchanged across Regional and Sub-Regional centres this quarter, Neighbourhood centres recorded solid growth of 0.4% led by Sydney and Perth.
While retail transaction volume fell compared to last quarter, the $1.6 billion of deals done represented the second-strongest March quarter result in the history of the data series (back to 2007). The strong outcome was largely driven by large format retail and Regionals, with solid support from Sub-Regionals. Centuria’s acquisition of Logan SuperCentre ($115 million) was the dominant large format trade, while Northland Shopping Centre and Cockburn Gateway comprised the Regional deals. Northland was notable in being Victoria’s largest retail transaction since 2018.
This quarter provided further evidence that the cycle has started to turn for the retail sector. Regional shopping centre yields compressed in every market, while Sub-Regional yields compressed in every market bar Sydney.
Occupier take-up (gross demand) continued to hold up, totalling just under 800k sqm which was the strongest March quarter in three years. While Transport, Postal & Warehousing, Manufacturing, and Retail & Wholesale Trade remained the top three industries from a demand perspective, it was the smaller and more volatile industries such as Professional Services, Mining, and Construction which experienced the strongest increase in demand relative to historical levels. Sydney recorded the highest level of gross space demand, headlined by Aldi’s pre-lease of an 87,000 sqm cold storage facility which is due to complete in 2027. The precinct this site is located in, Sydney Outer Central West, accounted for 37% of national demand and 86% of Sydney demand over the quarter.
Rent growth remains above the long-term average despite a weakening of demand relative to supply. Growth was more broad-based than last quarter, with face rents increasing in 17 of 22 precincts. The smaller markets of Adelaide and Perth recorded the strongest rental growth over the quarter, with Adelaide providing all of the top three precincts. Prime incentives continued to nudge higher across the east coast and Perth, reflecting a more competitive leasing environment.
Supply completions over the quarter were concentrated in Melbourne, as has generally been the case over the past five years. The West precinct was again the main provider of new space, however Melbourne South East was not far behind. It was a particularly muted quarter for development in Sydney, with only 43k sqm reaching completion versus the five-year quarterly average of more than 170k sqm. While a substantial pipeline of 1.5 million sqm remains under construction and due to complete in 2025, actual supply delivered may prove to be spread out over a longer horizon given projects continue to be delayed.
Industrial transaction volume fell below the quarterly average of the last five years as no major portfolio deals occurred. While Sydney accounted for the largest share of transactions by dollar value, Brisbane was the most active market compared to its historical average. Despite a relatively quiet quarter of dealmaking, there are signs the valuation cycle is starting to turn for industrial. Sydney, the bellwether market, recorded yield compression across most precincts.
Outlook
Where the global economy lands as a result of trade protectionism will depend on the duration barriers are in place, the extent of any retaliatory measures, and outcomes of trade negotiations. The situation is shifting on a daily basis, and the resultant uncertainty is having a dampening effect on economic activity.
While Australia is less exposed to the economic consequences than many other countries, there is a risk that growth weakens, and this could soften leasing demand in the near-term as companies take a cautious approach to investment and expansion. In this kind of environment, high-quality assets providing stable income from blue chip, resilient tenants are desirable.
Increased uncertainty may also affect liquidity in commercial property capital markets. Positively, Australia’s standing as a stable and reliable investment destination offering attractive returns has arguably been enhanced over the past month, and this could support acquisition activity from offshore capital. During this period of heightened volatility, focusing on underlying property fundamentals and sticking to a long-term strategy should hold investors in good stead.
Cromwell Direct Property Fund – March 2025 Quarterly Update
Below is the latest quarterly update for the Cromwell Direct Property Fund (the Fund), where we share key developments, portfolio performance, and what’s coming up in the months ahead.
The Fund’s next Liquidity Event—its Periodic Withdrawal Opportunity—is proposed to commence in July 2025. Investors will receive an information pack in May, which will include market commentary and helpful insights to support your decision on whether to redeem some or all of your investment or remain invested as the market enters the recovery phase.
The Liquidity Event is designed to occur every five years, although the timing can be adjusted under certain circumstances. Under the current indicative timetable, investors will be able to submit withdrawal requests between 1 July and 5pm (AEST) on 31 July 2025.
For Unitholders who invest directly in the fund, requests must be submitted to our registry provider, Boardroom Pty Limited, using the specific Withdrawal Request form which will be provided to you via email, and uploaded to the Fund’s webpage, before the Notice Period commences.
For indirect investors, please consult your Adviser or IDPS operator who will submit requests on your behalf5.
Requests must be submitted to our registry provider, Boardroom Limited, using the specific form included in your information pack and available on the Fund’s webpages.
Redemptions will be processed in accordance with the Fund’s rules and may be funded through a mix of new capital, debt (subject to gearing limits), and potential asset sales. Depending on the number of requests received, and the liquidity available to the Fund from those sources, withdrawals may be paid in instalments over time, rather than as a single lump sum.
Full details will be provided in the information pack. If you have any questions about the Liquidity Event or would like to discuss your options, our Investor Services Team is here to assist.
Portfolio performance
The Fund’s portfolio continues to perform strongly, with occupancy at 96.5% and a weighted average lease expiry (WALE) of 3.6 years.
Our expert in-house Facilities Management team demonstrated exceptional responsiveness in early March as Cyclone Alfred approached South-East Queensland. Although downgraded to an ex-tropical cyclone by landfall, the storm caused damage to glazing at the 545 Queen Street building in Brisbane due to airborne debris. Emergency safety works were completed within days, with repairs managed efficiently in collaboration with specialist consultants and insurers.
Tenant engagement and Environmental, Social, and Governance (ESG) initiatives
Cromwell Funds Management continues to prioritise tenant engagement and ESG performance across the Fund’s assets. A variety of tenant-focused initiatives were delivered this quarter, including Welcome Back to Work, Valentine’s Day activations, International Women’s Day, the Share the Dignity drive, and Earth Hour. These events enhance tenant satisfaction and support strong lease renewals in a competitive market.
There were also several ESG milestones achieved:
Flinders Street, Townsville received its first 6-star NABERS Energy rating, a 5.5-star Water rating, and increased its Renewable Energy Indicator to 99.3%, thanks to its use of 100% green power since January last year.
Solar installations across multiple assets have led to reductions in base building electricity consumption by up to 27% over the past 6–9 months.
Results from the latest tenant survey showed that 61% of respondents consider ESG factors important or very important in their leasing decisions.
Recent building enhancement
A major upgrade to the heating system at 100 Creek Street, Brisbane, was completed during the quarter. This project included the installation of electric duct heaters, mechanical switchboards, and an upgrade to the Building Management System (BMS), ensuring a comfortable environment for tenants during the winter months. The works were delivered with minimal disruption and came in just under budget—a testament to the expertise of our Projects Team.
Footnotes
Data sourced from various ABS publications, except where otherwise specified
CBA, 9 April 2025
NAB, 2 April 2025
Large occupiers are those greater than 1,000 sqm
IDPS Operators are not required to complete the Withdrawal Request Forms. Operators can lodge withdrawal requests for their underlying clients by sending the registry electronic messages to redeem via Calastone.
About Cromwell Direct Property Fund
Read more about Cromwell Direct Property Fund, including where to locate the product disclosure statement (PDS) and target market determination (TMD). Investors should consider the PDS and TMD in deciding whether to acquire, or to continue to hold units in the Fund.
The S&P/ASX 300 A-REIT Accumulation Index gave back some of the gains seen in the previous quarter, dropping 6.1%. Property stocks underperformed …
Stuart Cartledge, Managing Director, Phoenix Portfolios
Market Commentary
The S&P/ASX 300 A-REIT Accumulation Index gave back some of the gains seen in the previous quarter, dropping 6.1%. Property stocks underperformed broader equities in the period, with the S&P/ASX 300 Accumulation Index only losing 0.8%. The key factor affecting the performance of property stocks was the movement in interest rates. After beginning the quarter at just under 4.0%, the Australian Government 10 Year Bond yield, closed 2024 at approximately 4.4%. Related to this, expectations of interest rate cuts by the Reserve Bank of Australia have been delayed.
Office property owners were particularly weak during the quarter. Some sales evidence across a range of office property types did occur in recent times after an extended dearth in transactional activity. Dexus (DXS) announced the sale of two properties, 100-130 Harris Street in Pyrmont, adjacent to the Sydney CBD and 145 Ann Street in Brisbane, both at a capitalisation rate of approximately 7.6%. The sales represented a small discount to prevailing book values and are significantly below peak valuations. DXS closed the quarter down 9.6%. Other office owners fared worse, with Centuria Office REIT (COF) off 11.4%, GDI Property Group (GDI) losing 11.8% and Cromwell Property Group (CMW) giving up 13.9%.
Shopping centre owners performed broadly in line with the property index after strong performance in recent periods. Owner of Australian Westfield-branded shopping centres Scentre Group (SCG) lost 6.0%, whilst the owner of foreign Westfield-branded shopping malls, Unibail-Rodamco-Westfield (URW), dropped a similar 5.9%. Competitor, Vicinity Centres (VCX), fell a lesser 5.0%. Owners of smaller neighbourhood and subregional shopping centres underperformed their larger counterparts. Region Group (RGN) lost 6.7% and Charter Hall Retail (CQR) w as weaker, off 9.3%.
Owners of industrial property were also mostly underperformers, as market rent growth appears to have cooled from generationally strong numbers, however, remains positive. There also appears to be an increase in incentives offered to industrial tenants providing further evidence of a slowdown. Dexus Industria REIT (DXI) finished the quarter 10.0% lower, while Centuria Industrial REIT (CIP) fell 10.6%. Bucking the trend was Garda Property Group (GDF), which rose 5.4% in the quarter. This solid result came on the back of the sale of GDF’s massive North Lakes asset. The asset is a big land holding in the North of Brisbane, slated for the development of an industrial estate. Its true value was highly uncertain and the sale for $114 million (to close in 2025) both provides certainty and crystalises meaningful value creation for GDF shareholders. Property fund managers faced mixed fortunes in the quarter. Negatively, Charter Hall Group (CHC) underperformed, dropping 8.7%. Goodman Group (GMG) outperformed the broader index, however still lost ground, finishing the quarter 3.2% lower. Property debt fund manager Qualitas Group (QAL) was a strong performer, adding 16.1%, as it will be a beneficiary of higher interest rates to the extent that they do not cause losses on residential development projects. HMC Capital Limited (HMC) rallied, gaining 20.2% after listing a data centre REIT in the period. For more, see this quarter’s feature article below.
As we flagged may be the case, M&A activity in undervalued, small capitalisation property stocks has seen a noticeable uptick. Both AV Jennings Limited (AVJ) and Eumundi Group Limited (EBG) received takeover bids at meaningful premiums to prevailing share prices. For more see the performance commentary section of this report. In addition, CQR’s takeover of Hotel Property Investments (HPI) appears all but certain to complete, having gone beyond the minimum acceptance level.
The listed property sector is in good shape and provides investors with the opportunity to gain exposure to high quality commercial real estate at a discount to independently assessed values. While share market volatility may be uncomfortable at times, the offset is liquidity, enabling investors to rebalance portfolios without the risk of being trapped in illiquid vehicles.
Rising interest rates have been a headwind for many asset classes, with property, both listed and unlisted, a particularly interest rate sensitive sector. More recently, interest rates have been volatile, leading to mixed returns in property securities. The August reporting season saw stocks providing solid updates, with meaningfully more optimistic outlooks, based on the assumption that interest rates may have peaked and begun to come down. Long term valuations are driven by “normalised” interest costs, meaning the impact of short term hedges maturing is mostly immaterial. Should the forecast decline in interest rates eventuate, performance may be solid once again.
The industrial sub-sector continues to be the most sought after, given the tailwinds of e-commerce growth, the potential onshoring of key manufacturing categories and the decision by many corporates to build some redundancy into supply chains to cope with current disruptions. All of these factors are contributing to ongoing demand for industrial space, which is evident by rapidly accelerating market rents and vacancy rates at historic lows of around 2% in many markets. Strong rental growth has somewhat cooled and has been offset by capitalisation rate expansion in recent periods resulting in flat valuations and capitalisation rate spreads to government bonds more in line with long-term norms.
We remain cognisant of the structural changes occurring in the retail sector with the growing penetration of online sales and the greater importance of experiential offering inside malls. Recent performance of shopping centre owners has however been strong, with consumers showing resilience and share prices moving sharply higher. It is interesting to note the juxtaposition of very high retail sales figures despite very low levels of consumer confidence, no doubt impacted by rising costs of living. Importantly, we are also now seeing positive re-leasing spreads in shopping centres, indicating strengthening demand from retail tenants.
The jury is still out on exactly how tenants will use office space moving forward, but demand for good quality well located space remains. Leasing activity is beginning to pick up, and there has also been some transactional activity, albeit at prices typically at discounts to book values. Incentives on new leases remain elevated.
We expect to see further downside to asset values in office markets, but elsewhere expect market rent growth to largely offset cap rate expansion, particularly in industrial assets.Listed pricing provides a buffer to such movements.
Some of the biggest events of the quarter happened far from our shores, none bigger than the US election where the incumbent Democratic Party ceded control of the Senate and Donald Trump secured the keys to the White House. This was the biggest election year in history globally2 and it turned out to be a year where voters turned against incumbents, with the final quarter also seeing Japan’s ruling Liberal Democratic Party reduced to coalition government. The US and Japan results followed similar outcomes in the likes of India, South Africa and the UK earlier in the year.
Cost-of-living pressures and the state of economies more broadly appear to have contributed significantly to election results. In Australia, the economy continues to fare relatively well compared to peer markets. Underlying inflation is tracking towards the target band and the labour market is a particular bright spot, with only 3.9% of those in the labour force unemployed. However, population growth is doing a lot of heavy lifting – this quarter saw the release of September GDP data, which showed real GDP growth of 0.8% year-on-year but a per capita decline of -1.5%.
The final quarter of the year is where the rubber hits the road for businesses – particularly retailers – exposed to the discretionary wallets of households. On this front, sales events such as Black Friday and Cyber Monday are becoming increasingly important. These events have shifted promotional activity (and spending) earlier, from December to November. While official ABS data for November retail sales are not available at the time of writing, higher frequency trading indicators from some of the banks suggest the promotional period did generate strong growth, led by discretionary non-food categories such as clothing. However, a more accurate assessment of performance over the quarter requires December data to be released (early February) given the slowdown that now tends to occur after the sales events conclude. While it does appear that the Stage 3 tax cuts and easing inflation pressures are providing some degree of stimulus to discretionary spending, a more significant improvement in retail growth may not be seen until cash rate cuts materialise.
It was another positive quarter for office space fundamentals to end the year. Analysis of JLL Research data indicates over 30,000 square metres (sqm) of positive net absorption (demand) was recorded across the major CBD markets in aggregate, taking net absorption to over 160,000 sqm for 2024. This was the strongest year (on a rolling basis) for net demand since mid-2019. The positive quarterly result was relatively broad-based, with every CBD market except Melbourne (-1,800 sqm) and Perth (-2,300 sqm) recording demand expansion. Brisbane CBD was the top performer, underpinned by solid demand across small and large occupiers. Sydney CBD also performed well, with small occupiers leading the demand for space.
While demand was solid, supply completions contributed to the national CBD vacancy rate nudging 0.1% higher to 15.2%. This was almost entirely driven by Sydney CBD, where vacancy increased in every precinct except the Core. The vacancy rate remained flat or decreased in every other CBD market except Perth (+0.1%), with Brisbane CBD the strongest performer due to demand tailwinds and no stock completions over the quarter. In a positive indicator for the future direction of the vacancy rate, sub-lease vacancy has now reverted to the long-term (20 year) average, as large occupiers have re-absorbed space they were previously offering to the leasing market.
The pace of national CBD prime net face rent growth (+1.2%) remained slightly above the long-term average over the quarter and contributed to strong growth of 5.0% over the year. Every market recorded rent growth with Adelaide CBD the biggest improver (+1.6%). Incentives were largely unchanged except for Canberra (+0.6%) and Melbourne CBD (+1.4%), with net effective rents in those two markets falling as a result. Brisbane CBD took a breather after three consecutive very strong quarters, however supply-demand conditions remain favourable. Sydney CBD recorded another solid quarter, somewhat masking a two-speed market where the Core continues to outperform other precincts.
Transaction volume exceeded $2 billion for the third quarter in a row. This took the annual figure to $8.4 billion, a healthy increase of nearly 50% compared to 2023. While deal activity is still some way short of pre-COVID levels, there are signs that capital has started to move the office sector out of the ‘do not touch’ bucket. Sydney CBD accounted for the largest transaction of the quarter, BGO’s ~$580 million acquisition of 10-20 Bond Street. There was also elevated activity in some Sydney fringe and suburban markets which lifted overall Sydney transaction volume to $1.4 billion. Consistent with its stronger underlying fundamentals, Brisbane continued to comprise an above-average share of national deal activity. Melbourne recorded its weakest calendar year of transaction volume since the Global Financial Crisis, reflecting the vacancy challenges and uncertainty that persist in that market.
Across the major CBD markets, average prime yields expanded by 12.5 basis points (bps) in Brisbane and 25bps in Melbourne – all other CBDs were unchanged. Melbourne yields are now in line with Brisbane, a rare position, as investors demand a higher risk premium to account for the southern state’s weaker outlook.
Space market fundamentals improved across core retail (Regionals/Sub-Regionals/Neighbourhoods) with the vacancy rate decreasing for every centre type over the last six months (biannual data print). Regional and Sub-Regional centres now have a lower vacancy rate than pre-COVID. A lack of supply has contributed to the tightening of conditions with core retail stock growth of only +0.7% recorded over 2024.
Despite an improving supply-demand balance, rent growth was relatively muted over the quarter. While Regionals and Sub-Regionals recorded strong net rent growth in South East Queensland, Sydney Neighbourhoods was the only other segment to record material growth. On an annual basis, the rent growth rate seen over 2024 was the strongest achieved since 2011 for every sector.
Transaction volume totalled ~$1.8 billion for the December quarter, taking the 2024 figure to $6.3 billion. Activity over the quarter was buoyed by the Regional sub-sector, specifically the circa $900 million acquisition of QIC’s Westpoint Shopping Centre by Haben and Hines. Sub-Regional activity was also solid with nearly $500 million of deals recorded for the centre type, slightly exceeding the five-year quarterly average. It was a relatively quiet quarter for convenience retail, with less than $200 million of Neighbourhood centres changing hands. There were further signs that the cycle is starting to turn for the retail sector, with no yield expansion recorded for any centre type or market. Sydney yields compressed across every centre type after nearly $1.3 billion of transaction evidence over the quarter.
Occupier take-up (gross demand) maintained last quarter’s level of around 840,000 sqm, remaining in line with the quarterly average of the past five years. Manufacturing had its second-highest quarter of demand on record (back to 2007) accounting for 40% of take-up. There were also large sites leased by individual users in smaller industries such as healthcare and equipment storage. Space demand was concentrated in Melbourne and Sydney, with both markets recording their strongest quarter in over a year. Brisbane was a relative drag and well down on its average level of the past three years, with only one lease greater than 9,000 sqm signed and the total number of lease deals decreasing versus last quarter.
Rent growth remains above the long-term average despite a weakening of demand relative to supply. The quarterly pace of rent growth was mixed across markets. In precincts where rents moved, strong growth was achieved. However, rents were unchanged in 12 of 22 precincts nationally, dragging headline growth rates. Brisbane was the standout performer with all three precincts recording rent growth of at least 3.7% (QoQ). Perth performed worst relative to last quarter as rents were unchanged across all of its precincts. Incentives had a limited impact on effective rent growth. They increased in Sydney’s outer ring precincts – where take-up is more driven by new developments and higher face rents were recorded over the quarter – but were largely unchanged across the other markets.
While over 900,000 sqm of industrial supply was earmarked for completion in the final quarter of 2024, less than 600,000 sqm was actually delivered as construction delays continued to push out project schedules. This theme is helping to maintain a reasonable supply-demand balance despite a record level of supply being delivered in 2024. Supply delivered over the quarter was concentrated in Melbourne, with completions in Sydney and Brisbane relatively muted. There are currently nearly 1.8 million sqm of floorspace under construction and due to complete in 2025. A key determinant of underlying space market conditions over the year will be how much of the planned development pipeline not currently under construction actually proceeds to commencement.
It was a fairly weak quarter for transaction volume, owing to a lack of large portfolio deals and weak activity in Melbourne (after a record quarter previously). While every other quarter during the year had a top transaction value of at least $600 million, the biggest transaction in Q4 was less than $200 million. Prime yields were relatively stable, with 25bps of expansion in two Melbourne precincts the only notable movements.
Outlook
There are still some offshore factors that could knock the Australian economy off course, namely geopolitical developments (e.g. Trump tariffs), conflict in the Middle East, and China’s waning economic growth. Positively, local conditions are largely evolving as hoped with inflation continuing to moderate as labour market gains are retained. While expectations continue to bounce around as new data is released, markets are currently forecasting at least one RBA rate cut by May3. This growing confidence that a rate cut will land in the first half of the year is supporting the stabilisation of commercial property market pricing which now appears to be occurring across all the sectors.
With capital market conditions appearing to improve and liquidity constraints easing, the strength of underlying property fundamentals should come into sharper focus. Opportunities that are aligned to Australia’s population growth tailwinds are well positioned, as are those where sentiment has become dislocated from property performance.
How did the Cromwell Funds Management fare this quarter?
In the last quarter, approximately 28% of the Cromwell Direct Property Fund’s (Fund) portfolio was revalued, with a further 19% revalued in October during the December quarter. This resulted in a 2.3% decrease in the Fund’s portfolio value, which now sits at $542 million, including its investments in the Cromwell Riverpark Trust and Cromwell Property Trust 12. The Fund is 58% hedged, with a weighted average hedge term of just over two years, positioning it well to benefit from potential future interest rate cuts. The Fund’s portfolio is currently 96.4% occupied, with a weighted average lease expiry of 3.6 years. Notably, this lease expiry metric does not include executed leases yet to commence, such as a six-year lease for over 2,100 sqm at 545 Queen Street in Brisbane, starting in March 2025.
In December, the Cromwell Riverpark Trust, of which the Cromwell Direct Property Fund owns 23% valued at just over $32 million, held an Extraordinary General Meeting. Unitholders were asked to vote on extending the Trust’s term through to 31 December 2026. Of the almost 70% of Unitholders who voted, 88% were in favour of the proposal. The decision by Cromwell Riverpark Trust Unitholders to extend the investment term reflects a strategic approach to navigating current market challenges. By allowing more time for market conditions to stabilise and improve, the Trust aims to achieve a more favourable sale price for Energex House. The strong fundamentals of the Brisbane office market, combined with early signs of price stabilisation and potential future decreases in interest rates, support this decision to wait, rather than sell in a depressed market. Cromwell Funds Management will monitor the market closely to determine the optimal timing for launching a formal sale campaign for Energex House, aiming to achieve the best possible outcome for investors.
Cromwell Direct Property Fund’s portfolio is performing well against the 2025 financial year budgets, driven by the expertise of Cromwell’s asset management, projects, and leasing teams. Cromwell’s full in-house management model allows tenants to engage directly with staff on leasing, maintenance, ESG initiatives, and more.
Major capital expenditure projects are ongoing across the portfolio. These include carpet and lighting upgrades at the19 George Street asset in Dandenong, heating improvements at the 100 Creek Street asset in Brisbane, wet wall remediation works at the 420 Flinders Street building in Townsville, leasing works at 545 Queen Street in Brisbane, and lobby, end-of-trip, and carpark façade upgrades at Altitude Corporate Centre in Mascot. These efforts ensure the assets are maintained to a high standard, driving tenant retention and minimising downtime, particularly in multi-let assets such as the buildings at 100 Creek Street and 545 Queen Street in Brisbane.
Sustainability remains a key focus, exemplified by the recent lift upgrades at 100 Creek Street. The new motors provide energy savings of 55% compared to the older ones and regenerate 35% of the power used, feeding it back into the building grid. This initiative delivers both environmental and financial benefits, especially with rising energy costs.
In Adelaide, the team achieved strong leasing results at 95 Grenfell Street. While one tenant surrendered a full floor, they extended their lease on another floor for two years and paid a surrender fee, delivering a positive financial outcome. Terms have already been agreed to re-lease the surrendered floor for five years starting in April, ensuring minimal downtime.
Data sourced from various ABS publications, except where otherwise specified
A ‘super’ year for elections, United Nations Development Programme (2024)
As at 6 January 2025.
About Cromwell Direct Property Fund
Read more about Cromwell Direct Property Fund, including where to locate the product disclosure statement (PDS) and target market determination (TMD). Investors should consider the PDS and TMD in deciding whether to acquire, or to continue to hold units in the Fund.
The S&P/ASX 300 A-REIT Accumulation Index gave back some of the gains seen in the previous quarter, dropping 6.1%. Property stocks underperformed …


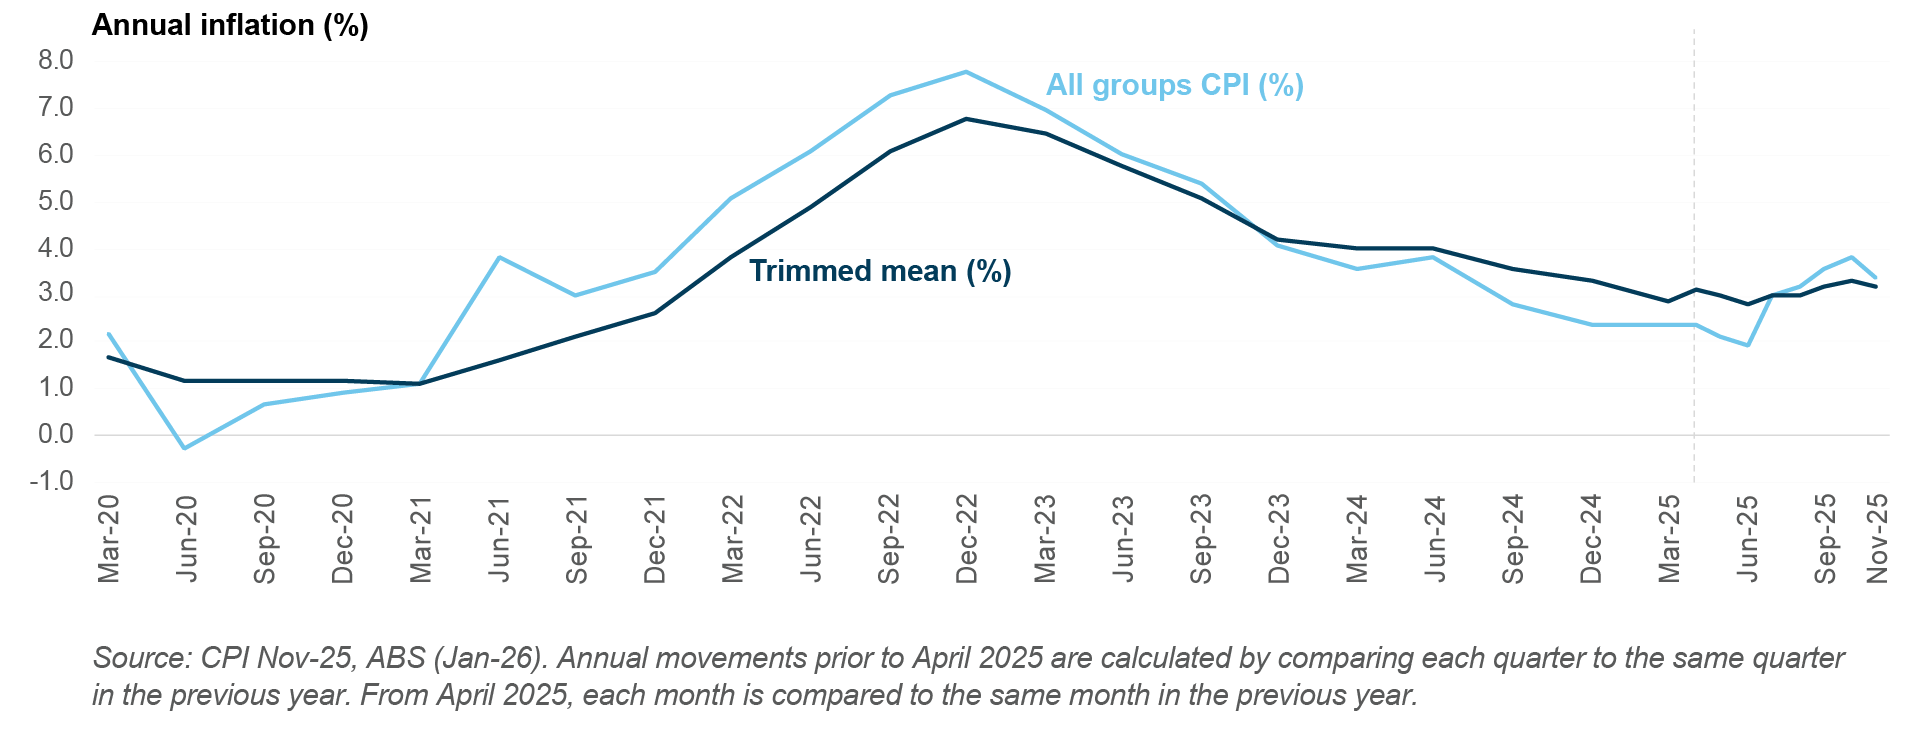
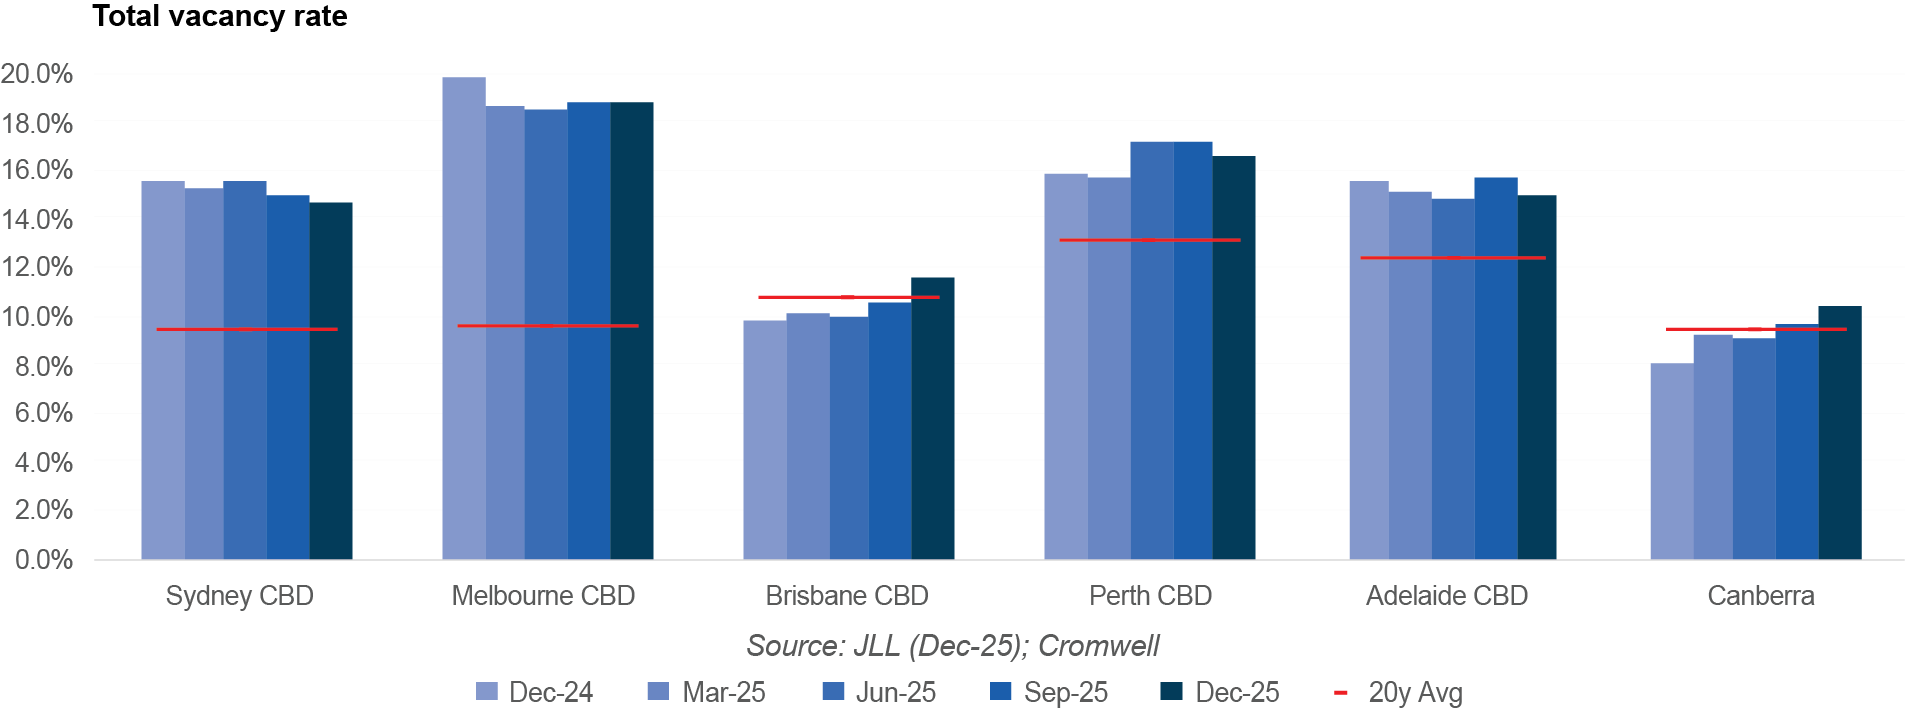


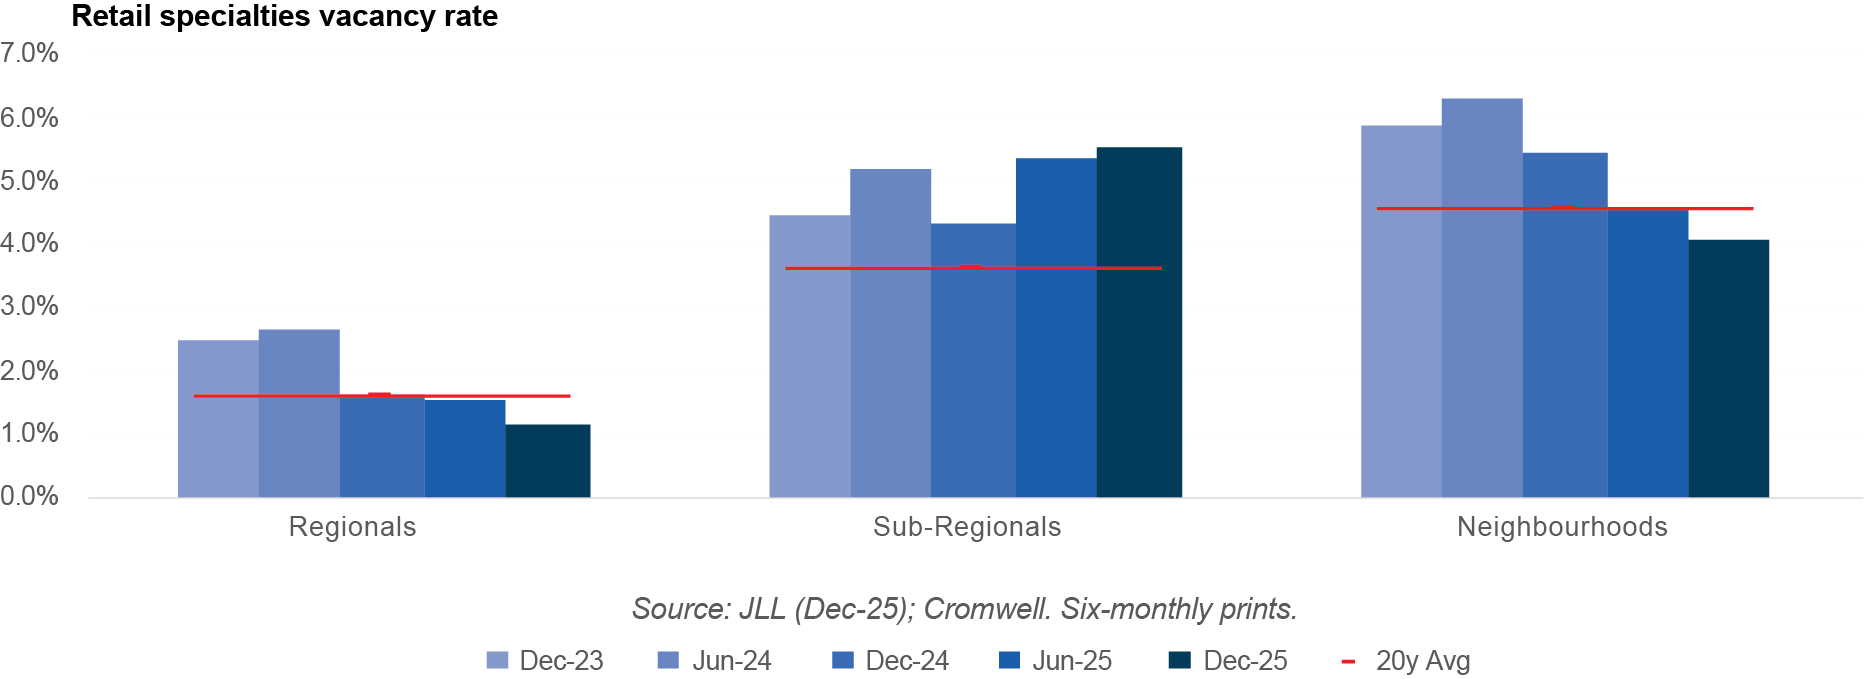


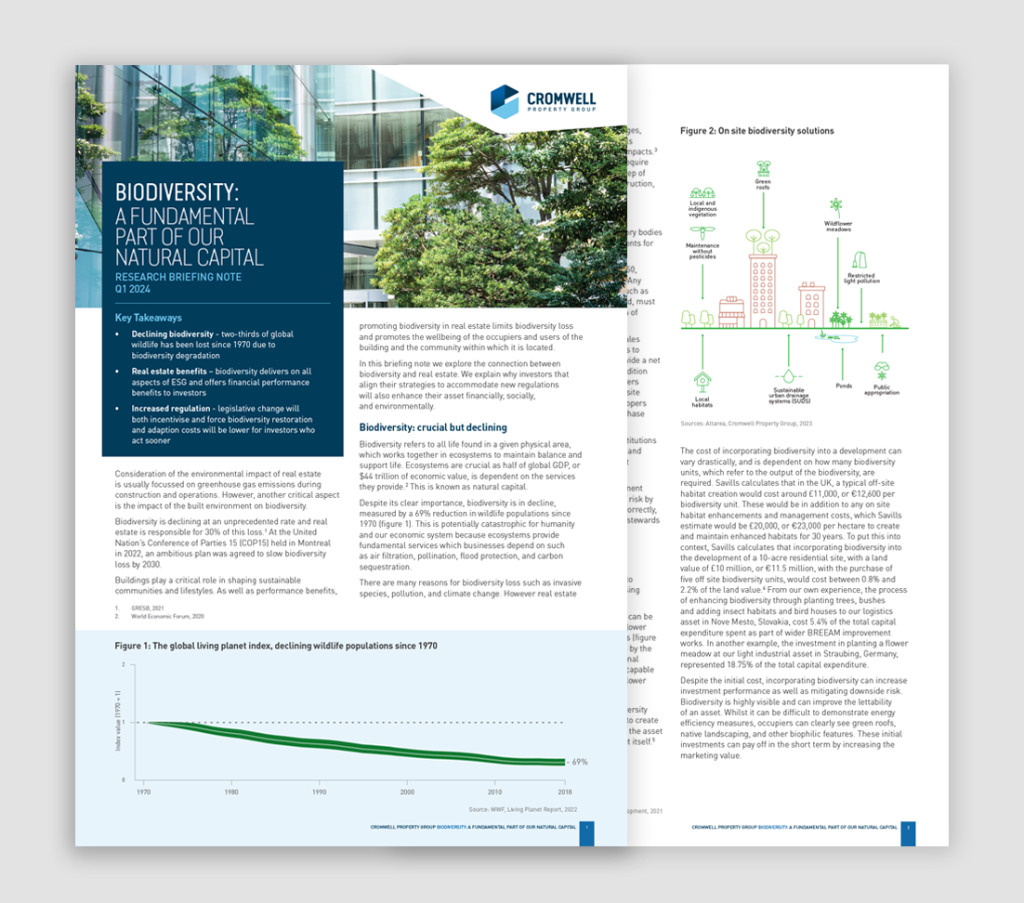
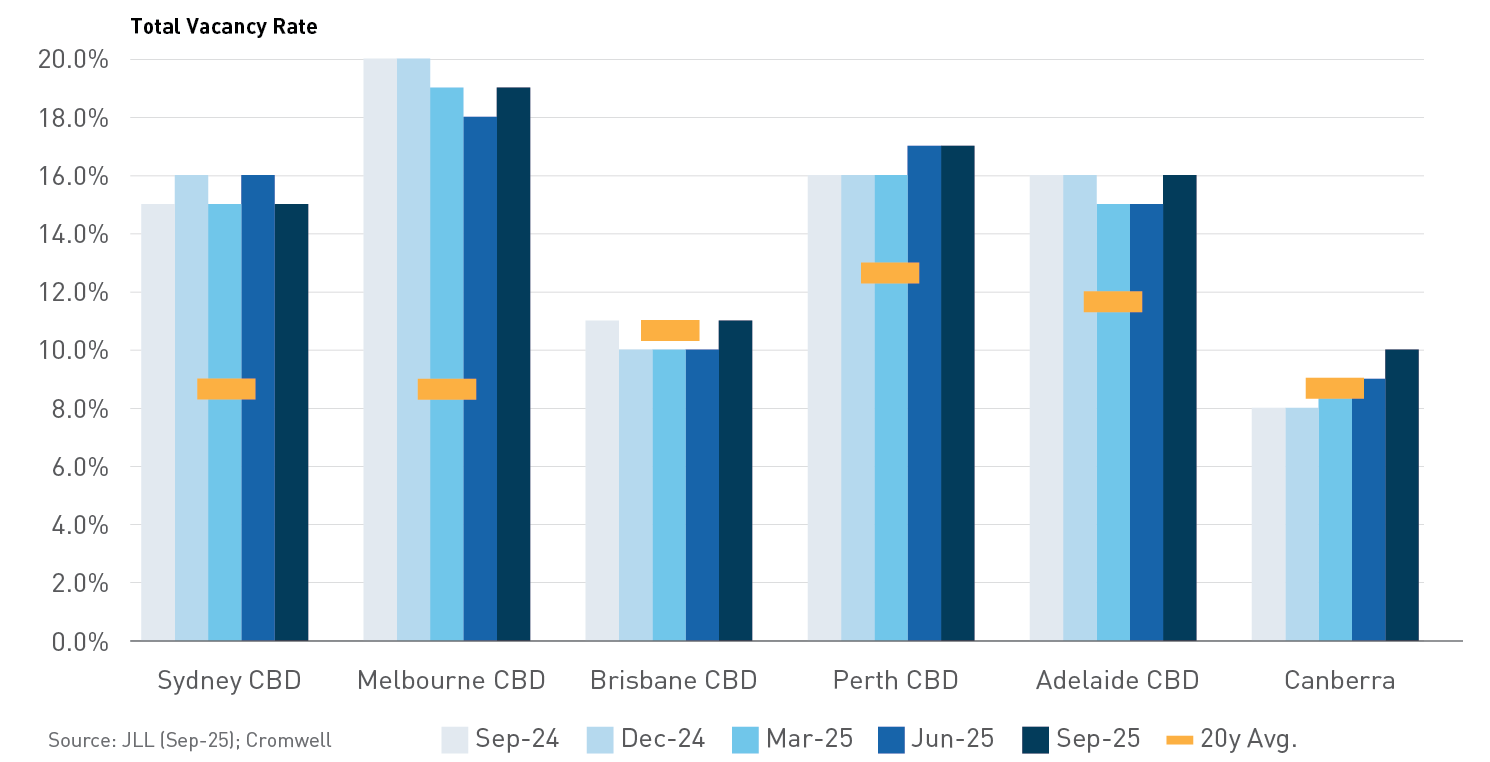
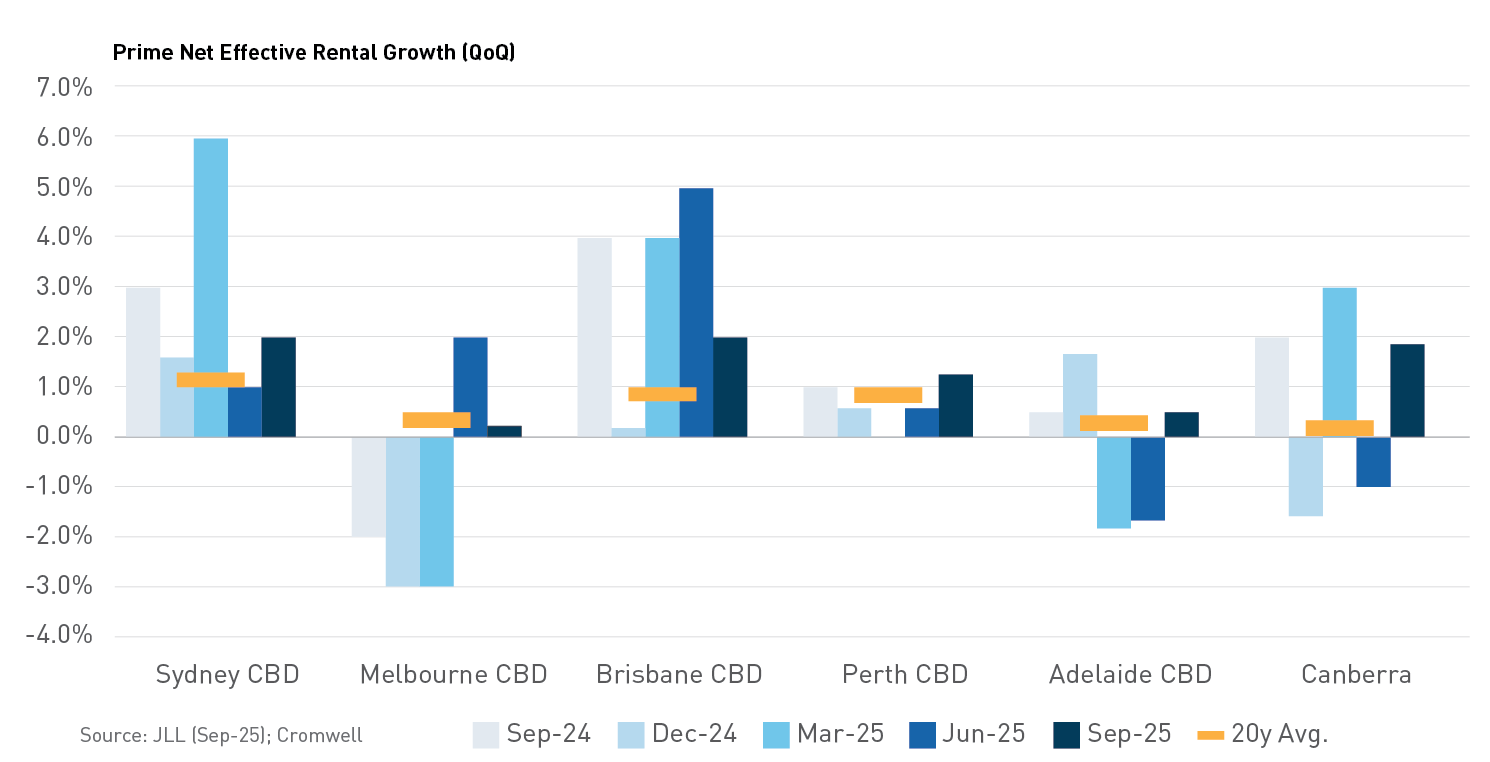


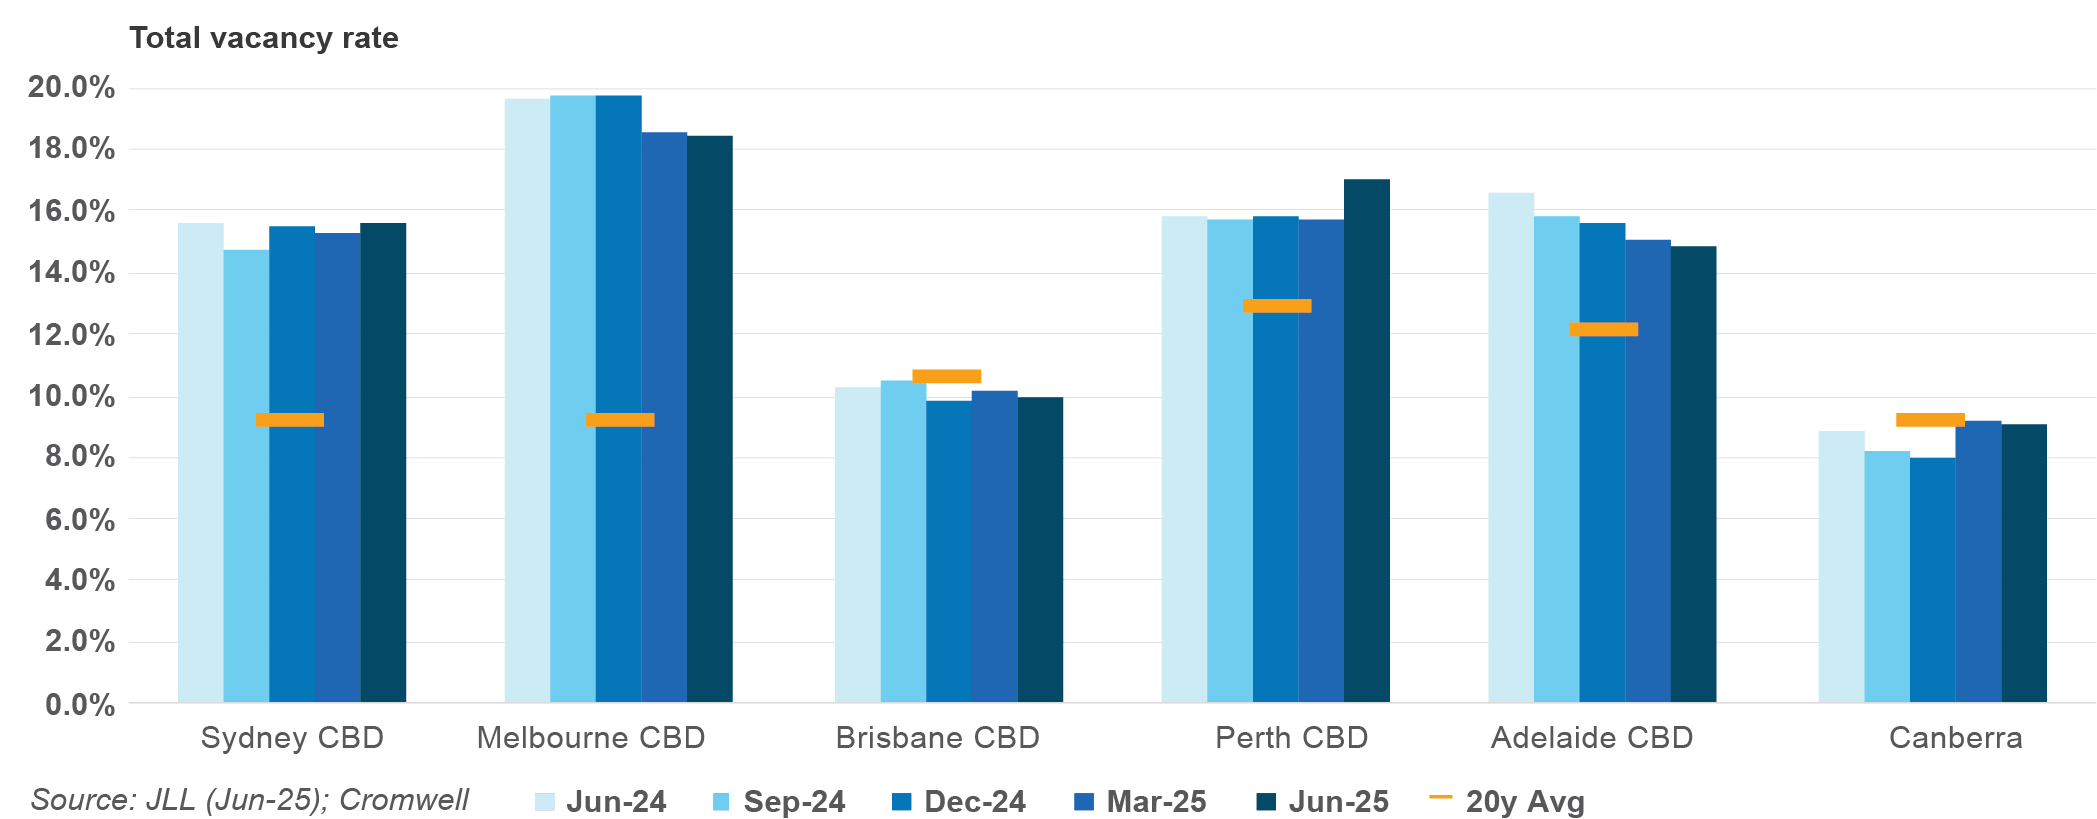

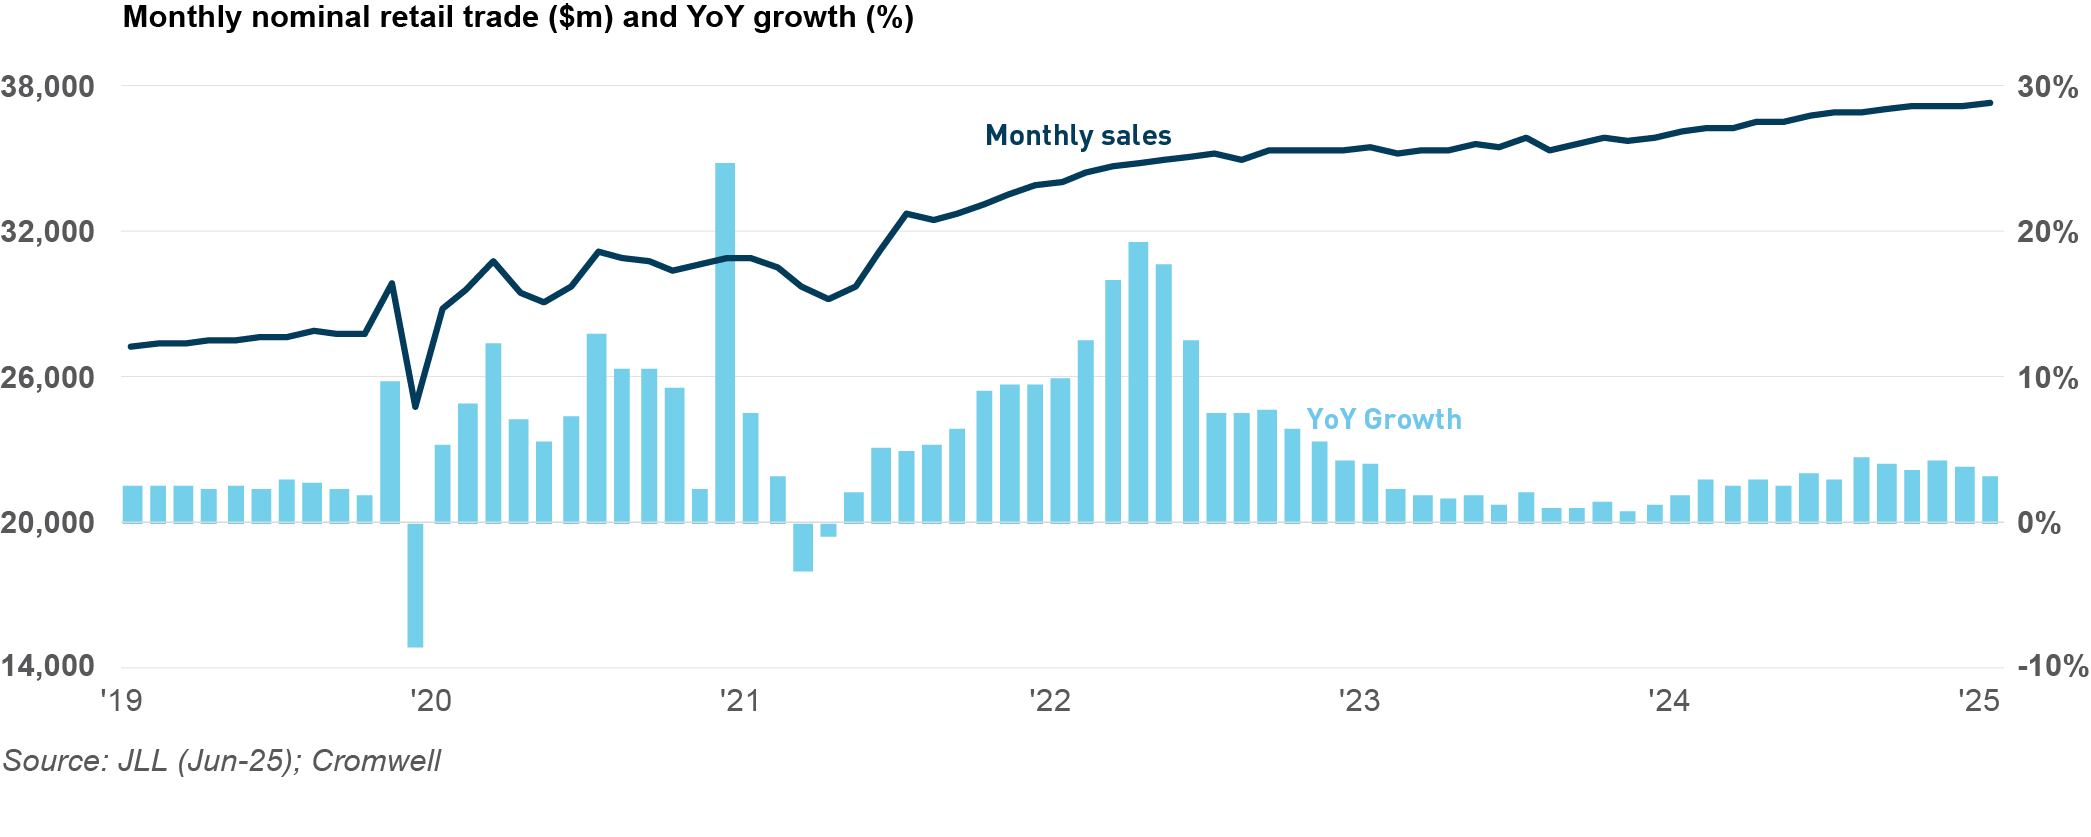
 How did the Cromwell Funds Management fare this quarter?