Redefining the office flight to quality: A Sydney CBD case study - Cromwell Funds Management
Person typing on a laptop

Learn

Home Redefining the office flight to quality: A Sydney CBD case study
October 11, 2023

Redefining the office flight to quality: A Sydney CBD case study

Colin Mackay, Research & Investment Strategy Manager, Cromwell Property Group


“Flight to quality” has been the real estate industry’s phrase of the year, particularly as it pertains to the office sector. While Cromwell agrees that a flight to quality is occurring and will continue to play out over the medium-term, our opinion of what that flight actually is – and indeed our definition of quality – is somewhat contrarian.

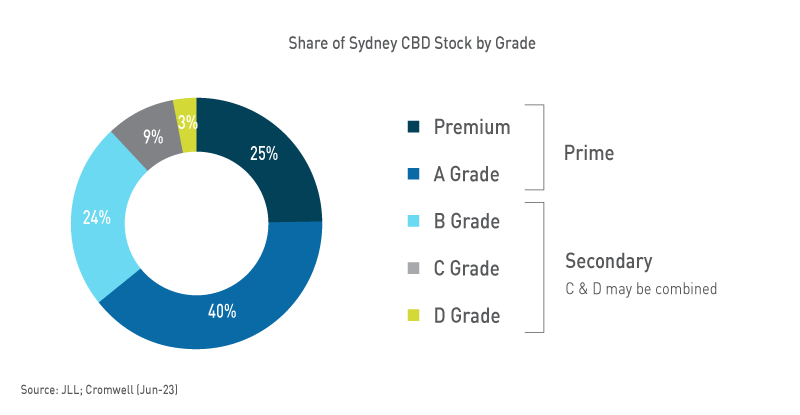
Quality has become synonymous with Premium – the top grade of office buildings. These buildings are modern developments with the largest floorplates, most internal amenity, and luxurious finishes and fitouts – and which naturally charge the highest rents. While this type of asset is an important part of the market, it’s worth assessing whether the popular narrative fits all the facts.

Are occupiers flocking to Premium assets at the expense of Secondary stock? Does the top-end of town hold all the cards?

Net absorption is important but doesn’t tell the whole story


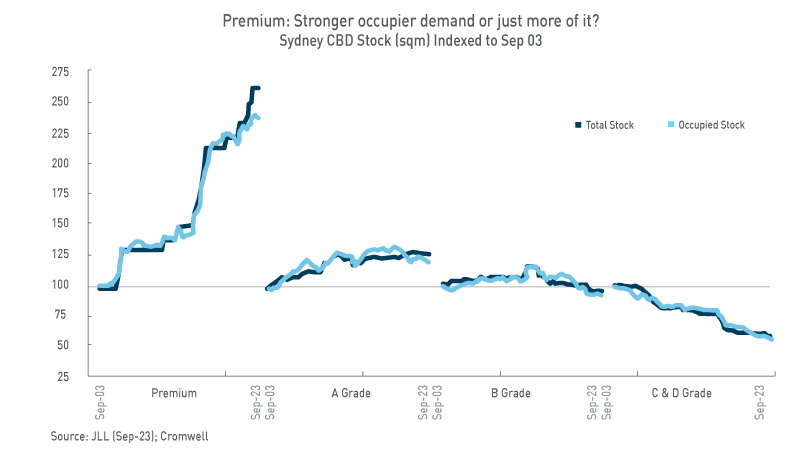
Net absorption is the metric often cited as evidence of the flight to (Premium) quality. In the Sydney CBD, Premium stock has recorded the strongest net absorption over the last 20 years at around +624,000 square metres (sqm), an increase in occupied stock of +137%. A Grade’s net absorption (+270k sqm) has been the second strongest over that time period, with the amount of occupied space increasing +18%. On face value, it’s easy to see why the “Premium is best” narrative has emerged – but there’s more to the story!

Premium has also seen the largest increase in total space.


Net absorption is the change in occupied (leased) space over a given period (often a quarter or year), represented in square metres. It is calculated by subtracting the amount of occupied space at the start of a period from the amount of occupied space at the end of a period. Positive net absorption means the amount of occupied space has increased, while negative net absorption represents a decrease.


Growth in occupied space is an expected by-product of the substantial increase in supply. On the other side of the coin, B Grade has recorded negative net absorption but also a decrease in total space – occupiers can’t lease space that doesn’t exist.

This dynamic is often seen in the lower grades as buildings are “withdrawn” (removed) from the market through conversion to different uses (e.g. residential). When we consider that rents are a function of demand and supply, it becomes clear that looking only at net absorption provides an incomplete picture of market conditions – we also need to look at the supply side of the equation.

On face value, it’s easy to see why the “Premium is best” narrative has emerged – but there’s more to the story!

Vacancy paints a different picture


Vacancy rates highlight a deterioration of demand relative to supply at the top end of the asset grade spectrum. In the Sydney CBD, Premium has the highest vacancy rate in absolute terms and when compared to its historical average.

B Grade has proven more resilient from an occupancy perspective, with vacancy actually decreasing over the last year.


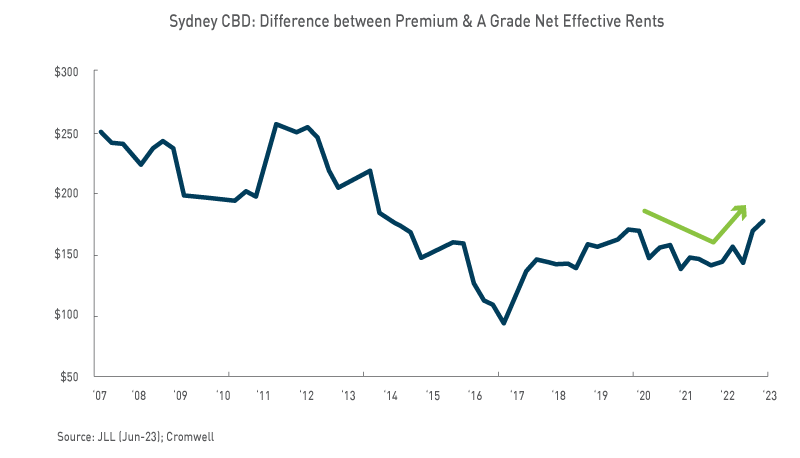
Despite elevated vacancy, Premium’s net effective rental growth has outpaced A Grade and B Grade over recent quarters. There are a couple of potential explanations for this counterintuitive result.

Time lags: It takes time for changing conditions to be grasped by market participants, for negotiations to be had and leases signed. Premium had the lowest vacancy rate until mid-2022, with its main occupiers adopting a “wait-and-see” approach to space decisions through the pandemic. Now, Premium occupiers are handing back space and driving vacancy higher, but current rental outcomes are reflecting the tight conditions of prior quarters.

Affordability: The spread between Premium and A Grade rents narrowed over 2021-22 as Premium incentives increased. Industry feedback suggests occupiers have taken advantage of the relative affordability to upgrade, taking up less space but at a higher rate per sqm. This is positive for market rental growth but less so for income growth, given the occupancy effect. We expect Premium upgrading to run out of steam as affordability worsens, with the spread recently increasing to its widest level since 2014.


Incentives are financial ‘sweeteners’ offered by landlords to encourage tenants to lease space. Common incentives include contributions to tenant fitout costs, rent-free periods, and rental abatements where the amount payable is reduced for a period of time. The rent received by a landlord after incentives are accounted for is referred to as an “effective” amount.


In any case, for investors, there’s limited value in knowing today’s performance – what really matters is the future.

Good things come in small packages


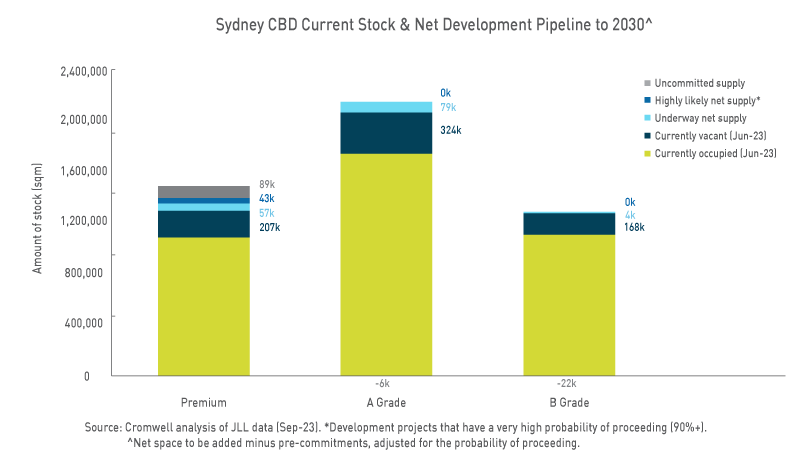
In our view, it will be difficult for Premium stock to maintain the current pace of rental growth, with A Grade stock likely to outperform over the medium-term due to lower vacancy, a less substantial supply pipeline, and favourable occupier trends.

Cromwell estimates there are 265k sqm of Premium space in the Sydney CBD which will need to be leased in the near term based on space currently vacant or completing by the end of 2024. This “baked in” amount is equivalent to 19.7% of current Premium stock. Future developments may deliver new supply to the market post-2024, however we only consider 43k sqm as highly likely on a probability-adjusted basis.

A Grade has a larger amount of space requiring leasing (403k sqm); however, it is smaller as a proportion of existing stock (18.8%). Unlike excess B Grade stock which may be withdrawn from the market via change of use, the only feasible option for Premium space is absorption via leasing. On this front, the Premium end of the market faces some challenges.

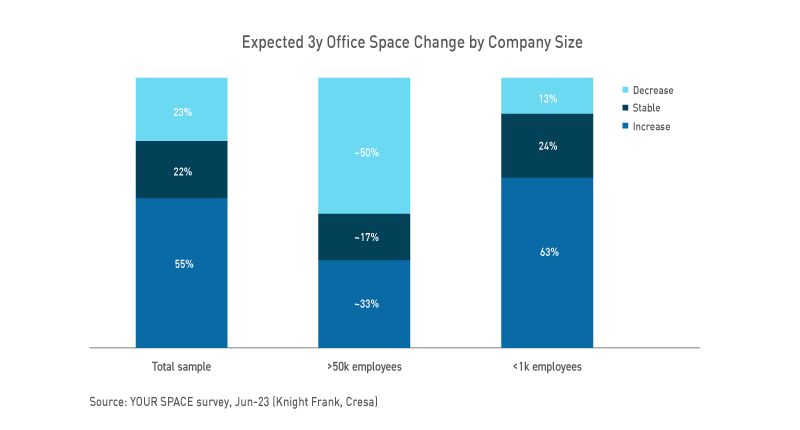
Space contraction impacts from work-from-home are being felt most keenly by assets with large floorplates. These buildings are expensive to divide into smaller tenancies and typically cater to the largest occupiers. Research1 points to an inverse relationship between occupier size and office usage, which is then being reflected in organisations’ plans to expand or contract their office footprint. The industries that predominantly occupy Premium buildings (financial services, professional services, tech) also demonstrate a lower propensity to use the office post-COVID.

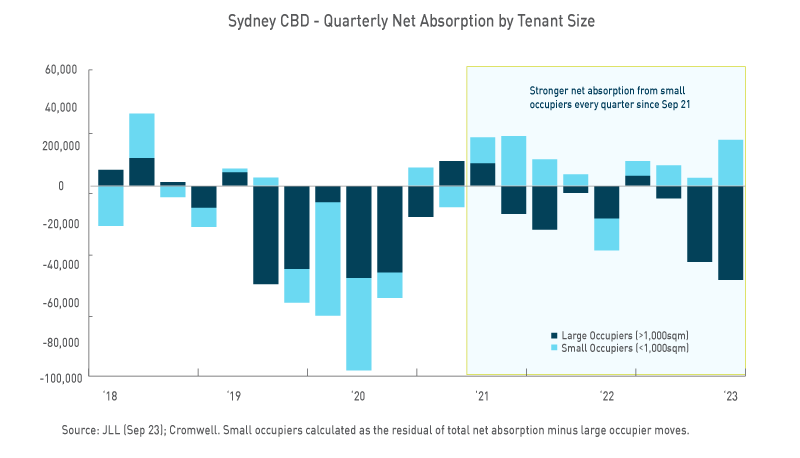
Australian leasing data corroborates the research findings. Net absorption has been far stronger across smaller (<1,000sqm) occupiers than large occupiers. The tendency to expand has also been far more positive, with smaller occupiers on average expanding their footprint by ~20% (national leasing deals from 1Q21 to 2Q22) compared to an average contraction of ~13% for occupiers larger than 3,000sqm2.

We believe the in-office bias of smaller occupiers versus larger occupiers reflects the nature of work typical across these organisations. Bigger firms are more regimented and siloed, with large administrative “back office” functions that predominantly perform focused tasks individually. These firms may have also invested more heavily in digital collaboration tools which facilitate remote work across a more geographically dispersed workforce. Smaller firms are more dynamic, with employees wearing multiple hats and undertaking work that tends to favour face-to-face interactions. Regarding smaller firms’ space expansion, this may be linked to their much stronger headcount growth through the pandemic. Businesses with 5-199 employees saw employment growth across the main office-using industries of 4.6% p.a. from Jun-19 to Jun-22, compared to -0.2% p.a. for businesses with 200+ employees3.


One of the arguments often made against exposure to smaller occupiers is that they are riskier than large occupiers, but the data shows this isn’t the case. While very small firms do fall over more often, those with 20-199 employees have nearly identical survival rates to firms with 200+ employees. The smaller occupier bracket is also broader and more diversified, with office-using businesses spanning many industries. By comparison, the large firm bracket is dominated by financial and professional services. Overexposure to large occupiers can also increase the risk that a significant portion of an asset becomes vacant at a single point in time, rather than being spread over a manageable leasing horizon.

Price doesn’t always equal quality


Conflating luxury with quality ignores the needs of many office occupiers. While the largest companies attract the most attention, most office-using Australian businesses are small and medium-sized enterprises (SMEs)4. With cost being the top driver of real estate decisions5, these SMEs are in the market for a Toyota, not a Rolls-Royce with all the extras. They want the highest quality office, in the best location, but within their price bracket. So then, what is “high quality” office? Ultimately, it’s space which meets the needs and preferences of its target occupiers.

Some occupier preferences are timeless and will persist no matter how workstyles and space usage evolve, for example availability of natural light, convenient access to transport and plenty of nearby amenity (e.g. dining and gyms). These are hygiene factors valued by occupiers of any industry or size.

The pandemic has rendered some requirements less important. Floorplate size has historically been a measure of quality and is one of the criteria that determines whether a building is considered Premium or a lower grade. But with occupiers’ office usage shifting towards collaboration and social connectivity, a smaller floorplate can create more incidental interactions and a better ‘buzz’ in the office. While there is a minimum viable size in terms of efficiency and layout, we’re finding bigger isn’t always better in the eyes of occupiers.

Other requirements have increased in importance as occupiers shift to a new way of working. A greater level of embedded technology is expected, to ensure a flexible working model can be facilitated. Greater diversity of spaces is needed to support focused work, collaboration, and flexibility, with implications for building layouts and landlord-led fitouts.
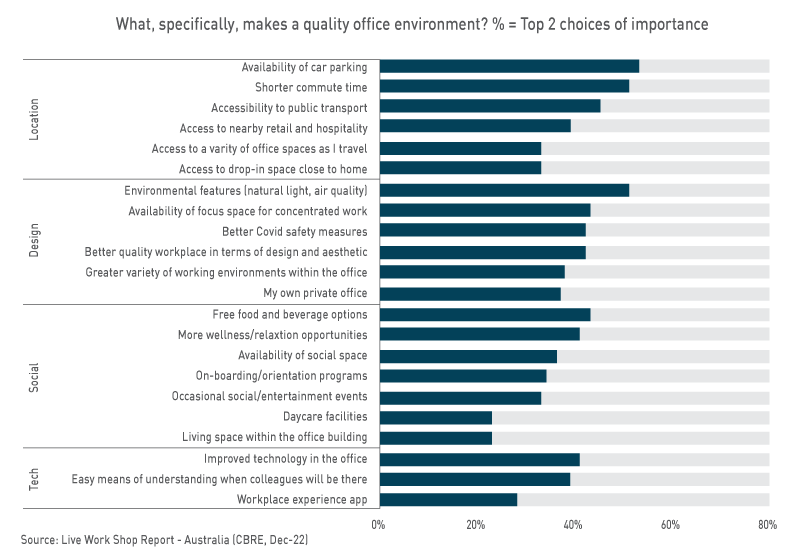
Sustainability also continues to increase in importance, with a wider array of organisations focusing on both the financial and social benefits it can provide, including staff attraction and retention.

Greater diversity of spaces is needed to support focused work, collaboration, and flexibility, with implications for building layouts and landlord-led fitouts.

Not always the more sustainable choice


The preference for sustainable space is becoming more tangible and spans a variety of stakeholders, including end users, occupiers, and investors. Premium buildings often have the highest sustainability ratings (e.g. NABERS), something which is used to support the view that occupiers will increasingly gravitate to these assets over time. But again, these ratings don’t tell the whole story.

While new Premium assets are top performers from an operational emissions perspective (e.g. energy usage), production of building materials and construction activities are the largest producers of embodied carbon emissions6. As the grid decarbonises, embodied carbon’s share of built environment emissions is expected to increase from 16% in 2019 to 85% by 20506 – in the pursuit of net zero, minimising the demolition of existing buildings and the construction of new ones will become far more important than building-specific energy efficiency. As the importance of embodied carbon becomes more well known and stakeholders adopt a whole-of-life view of emissions, newly built Premium assets may not be considered the greener option.


Embodied carbon: the emissions generated during the manufacture, construction, maintenance and demolition of buildings – Green Building Council of Australia (GBCA)


Is this only a Sydney theme?

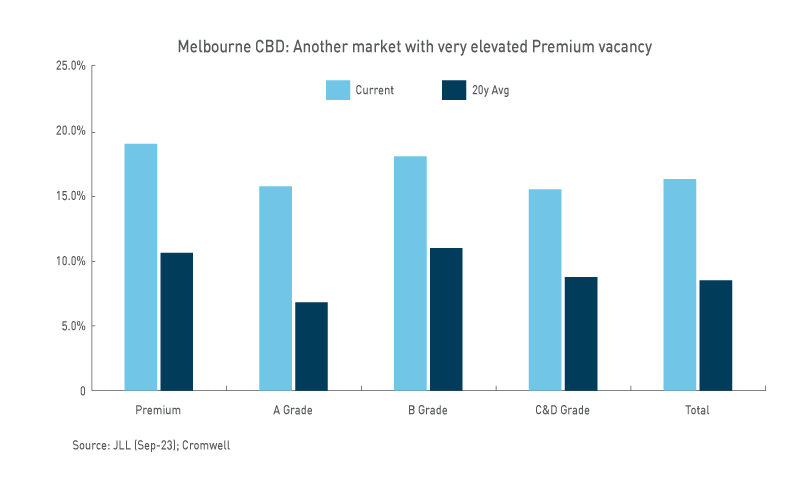
While this paper has focused on the Sydney CBD for simplicity and brevity, we see the same dynamics playing out in Melbourne. The CBD Premium vacancy rate is almost 19%, and Cromwell forecasts the amount of Premium stock will increase by 15% by 2026 based on new supply currently under construction. The same occupier trends are also occurring, with small occupiers recording positive net absorption of over +23k sqm since Dec-19, compared to negative net absorption of almost -241k sqm for large occupiers.

We believe the flight to quality is occurring across all grades – not just Premium – as occupiers seek space that is well-located, offers high amenity, and enables a flexible approach to working, but within their price bracket.

Look beyond the headline


“Flight to quality” has been a popular theme in the office sector. While positive net absorption has been used to support the notion that Premium buildings are outperforming lower grade assets, the metric can’t be looked at in isolation. Investors gain a more comprehensive understanding of market conditions by also considering other factors such as vacancy, supply impacts and occupier demand trends. We believe the flight to quality is occurring across all grades – not just Premium – as occupiers seek space that is well-located, offers high amenity, and enables a flexible approach to working, but within their price bracket. In our view, the A Grade segment of the market is best-positioned as it occupies an affordability-quality sweet spot, supported by ongoing demand from smaller occupiers and a smaller supply pipeline.


  1. Empty spaces and hybrid places (McKinsey, Jul-23); U.S. Office Occupier Sentiment Survey (CBRE, May-23)
  2. Australian Office Footprint Analysis (CBRE, Oct-22)
  3. ABS (May-23); Cromwell. Main office-using industries includes: Information media and telecommunications; Rental, hiring and real estate services; Professional, scientific and technical services; Administrative and support services; Education and training (private). Financial services employment breakdown is not published by the ABS.
  4. SMEs defined as businesses with 5-199 employees, within the same office-using industries as previously defined.
  5. What Occupiers Want (Cushman & Wakefield, Jul-23)
  6. Embodied Carbon & Embodied Energy in Australia’s Buildings (GBCA; thinkstep-anz, Aug-21)