Political uncertainty in the US was a defining theme over the last quarter, and it came to a head on October 1st as funding lapsed and the Federal government shut down, fuelling uncertainty over fiscal discipline and delaying key economic data releases. The shutdown became the longest in history, ending on November 12th after 43 days of disruption. As expected, the episode had limited impact on Australia.
Back home, a number of data prints indicated inflation and growth are both running a touch hotter than expected. The September quarterly CPI increased to 3.2% on a 12-month basis1, rising above the upper bound of the RBA’s target band. While the result was skewed higher by some volatile items like fuel, and administered prices such as utilities and property rates, the breadth of categories running above 3.5% year-on-year suggests some inflationary pressures remain in the domestic economy.
While households’ financial position has been improving, rising cautiousness and a greater degree of saving (rather than spending) threatened to dampen Australia’s economic growth recovery. Those concerns were somewhat allayed by the latest print of the Westpac-Melbourne Institute Consumer Sentiment index which surged by +12.8% to 103.8, marking the first time it has sat in positive territory since early 20222.
Similarly, the unemployment rate fell from 4.5% to 4.3% in October, unwinding the increase seen in the previous month. The result was underpinned by the creation of 55,300 full-time jobs and an unchanged participation rate3. The RBA would have likely welcomed the outcome, which helps avoid the tension that would come with a deteriorating labour market at a time of sticky inflation.
Following the latest data releases, markets now believe the RBA’s easing cycle has concluded, with no further cuts priced in over the forecast horizon4. Economists largely agree, however some forecasters still expect a rate cut in the first half of 2026.
Taken together, economic data suggests Australia is on track and in a better position than most countries. The key question is whether the RBA will leave monetary policy settings in restrictive territory for too long, however the Board is cognisant of the risk and will be guided by the data.
The office sector’s gradual recovery continued, with net demand for space expanding by nearly 57,000 square metres (sqm) over the quarter. Sydney CBD again saw the biggest absolute increase in demand (36,000 sqm), while the 25,000 sqm of net absorption recorded in Brisbane CBD represented the strongest growth on a percentage basis. Sydney’s demand was led by prime stock and the Western Corridor, a precinct which struggled through the pandemic but is now attracting tenants centralising from other markets (particularly north of the bridge). Brisbane’s strong quarter was more broad-based, with occupied stock increasing across the quality spectrum. Occupied space contracted in Canberra, the worst performing market over the quarter, largely due to the consolidation of a federal government department.
Despite the positive demand result, the national CBD vacancy rate edged +0.1% higher to 15.1% due to weakening conditions in lower quality stock. Sydney was the only CBD market to record a decrease in vacancy rate, underpinned by the absence of development completions over the quarter. Four projects were brought to market in Melbourne CBD and pushed the vacancy rate up +0.4%, however it remains below the peak seen in December 2024. Adelaide saw the largest increase in vacancy as 50 Franklin St reached completion with space still unleased.
National CBD prime net face rent growth maintained its strong pace, increasing +1.2% over the quarter and +5.9% over the 12 months to September. Canberra recorded the strongest growth over the quarter despite its softening vacancy rate – there is significant variance in this market as tenants prioritise higher quality premises with strong ESG credentials in specific precincts. Growth in Brisbane CBD also continued at pace, reflecting favourable leasing conditions. Prime incentives increased slightly in Canberra, consistent with the shift to newly developed premises, but remained relatively unchanged across the other markets. The combination of solid face rent growth and stable incentives contributed to higher rents on an effective (incentive-adjusted) basis. This was the first quarter since June 2022 where net effective rents increased in all the major CBD markets.
Office transaction volume strengthened over the quarter to $1.3 billion, but this level remains below the long-term average. The biggest recovery was recorded in Melbourne, which was the top-performing market (by dollar volume) for the first time since September 2022. Similar to last quarter, a lack of large deals dampened the national volume figure. There was further evidence that the office valuation cycle is at, or close to, the bottom, with average prime yields unchanged in every CBD market.
The ABS ceased publication of the Retail Trade series after the June release. While this reduces the granularity of retail data available, the Household Spending Indicator series still provides a solid read on consumer activity. Supportive conditions maintained the pace of spending growth over the quarter. Groceries continued to record stronger growth than discretionary categories, such as Clothing, while the mining states of Western Australia and Queensland continued to outperform New South Wales and Victoria.
Supply remains very constrained, particularly at the “big end of town”. There was no Regional shopping centre stock added for the fifth consecutive quarter, while a single Sub-Regional centre reached completion. Development of Neighbourhood centres is more pronounced, with annual stock growth running at 1.3% as at September. However, this is consistent with the delivery of new centres in population growth corridors and is still less than half the rate of growth averaged over the last 20 years.
This lack of supply is contributing to solid rent growth. On a net basis, Regional rents have grown 0.9% over the past year, outpacing Sub-Regionals and Neighbourhoods. Similar to office, Sydney and South-East Queensland recorded the strongest retail rent growth over the quarter.
It was another solid quarter of retail transaction activity with dollar volume totalling over $2.1 billion. The result was underpinned by Regional centres, as partial stakes in Bankstown Central and Westfield Chermside changed hands. Large Format activity was also elevated, headlined by the portfolio sale of six Bunnings assets by Wesfarmers. Neighbourhood centres saw slightly less activity than normal, while no Sub-Regional or CBD assets transacted. There was a moderate level of yield compression recorded over the quarter, led by Sydney which is typically the bellwether market for capital. Neighbourhoods tightened the most nationally, as investors continue to be attracted to convenience assets aligned to non-discretionary spending. Perth was the only market where yields were unchanged across every core shopping centre type.
Occupier take-up (gross demand) was largely in line with last quarter, totalling just over 823,000 sqm. Demand for this quarter was less dominated by a single tenant movement, with the largest leasing deal comprising just over 36,000 sqm of space. Transport & Warehousing was the main driver of the result with over 300,000 sqm of gross demand recorded, while a pickup in Manufacturing leasing helped offset weaker demand from Retail & Wholesale Trade. On a geographical basis, the result was largely consistent with last quarter – Sydney the most active market followed by Melbourne and Queensland.
Rent growth improved slightly on last quarter, averaging +0.8% nationally over the three months to September. Sydney was the top-performing market, with its Inner West precinct recording the strongest growth nationally (+3.5%) and the Outer Central West precinct also recording robust quarterly growth of +2.0%. Adelaide saw strong growth across its southern precincts and remains the top-performing market on an annual basis. Prime incentives increased in every Melbourne precinct, dragging effective rents lower, but were largely unchanged across the rest of the markets.
Delivery of new supply almost halved compared to last quarter, with less than 414,000 sqm of space brought to market nationally. This was the lowest quarter of supply since March 2023 and the most muted 3rd quarter since 2021, with limited completions in Brisbane and a lack of large projects the key drivers. Sydney and Melbourne accounted for 79% of supply over the quarter, a greater proportion than is typical. There is currently nearly 750,000 sqm of space under construction and due to complete in 2025, however, actual delivery may slip into subsequent periods given construction delays are persisting.
Industrial transaction volume strengthened further over the quarter, totalling nearly $3.5 billion across 102 deals. This was the highest number of deals conducted in a quarter since the data series commenced. Sydney and Brisbane were the standout markets, accounting for 60% of dollar transaction volume. The largest transaction of the quarter was Goodman’s acquisition of a 196-hectare site near the under-construction Western Sydney International Airport for around $575 million. While capital continues to prioritise Sydney, Perth was the market which saw the largest compression in yields (-25bps in every submarket). Brisbane also continues to be viewed favourably, with yields compressing in every submarket by 13-20 basis points.
Sign up to Insight Magazine
Stay informed about investing strategies, finance news, property market updates, and more by signing up for Insight. Build a solid foundation of investment knowledge to help you make the right investment decisions and guide you in planning your investment journey.
Trade policy uncertainty remains a headwind for investor confidence. While the global economy is gradually adapting to the current tariff settings, lower courts have ruled the measures illegal. The Supreme Court is set to hear the case from 5th November, with a final ruling likely in early 2026. If the Court upholds the lower-court decisions, the Trump Administration is expected to explore alternative legal avenues to re-establish the tariffs. In practice, the near-term economic impact may be limited, but the ongoing legal and policy uncertainty is likely to keep risk sentiment cautious until the issue is resolved.
Australia is somewhat insulated from the impacts of global volatility, including the most recent tit-for-tat escalations between the US and China. The key considerations domestically are the trajectory of services inflation and the willingness of the RBA to step in and stimulate activity if the labour market deteriorates more quickly. The economy is beginning to transition from public-led growth to private sector investment, but a more supportive monetary environment may be required to maintain momentum.
The commercial property market continues to stabilise, with improving sentiment evident in both capital flows and leasing fundamentals. Construction remains prohibitively expensive in most circumstances, cramping development pipelines and supporting the outlook for existing assets. Office appears to have reached an inflection point, while retail and industrial pricing continues to firm. As confidence returns to the asset class and institutional capital re-engages, identifying compelling opportunities will increasingly depend on a deep understanding of asset quality and positioning.
Footnotes
Cromwell analysis of ABS data (Nov-25)
Westpac-Melbourne Institute (Nov-25)
ABS (Nov-25)
ASX (Nov-25)
Related posts
December 2024 quarter ASX A-REIT market update
The S&P/ASX 300 A-REIT Accumulation Index gave back some of the gains seen in the previous quarter, dropping 6.1%. Property stocks underperformed …
Strategic Asset Enhancement: Unlocking Long-Term Value at 400 George Street
Located in Brisbane’s prestigious North Quarter, 400 George Street is a 35-level commercial tower offering 43,978 square metre (sqm) of net lettable area across office, retail, and childcare. With an 89.8% occupancy rate supported by blue-chip corporate and government tenants, the building is a cornerstone of the precinct’s commercial landscape.
Now, with a lobby transformation underway, 400 George Street is entering a new phase of strategic enhancement—one designed to elevate its market positioning, continue to attract premium tenants, and unlock long-term value.
The refurbishment strategy
Scope of works:
400 George Street is undergoing a comprehensive redevelopment of its ground floor lobby, designed to modernise the space and elevate both its functionality and visual appeal. Key upgrades include a new street-facing entryway, an internal staircase and a new terrace, creating a more seamless and welcoming arrival experience.
The refurbishment will introduce flexible zones that support both informal and formal meetings, catering to the diverse needs of tenants. Additionally, a new 235 sqm food and beverage retail tenancy—featuring indoor and outdoor access—will be integrated into the lobby, enhancing social interaction and lifestyle convenience within the building.
Design vision
Led by renowned architects, Woods Bagot, in collaboration with Cromwell Property Group and Shape Australia, the lobby refurbishment is set to focus on creating a seamless, welcoming, and functional space. The vision is to emphasise connectivity, natural light and a premium finish. “The design concept is conceived as a landscaped garden portal which creates a unique urban subtropical experience that is enriched through the natural stone cladding, the generous landscape provision, and the integration of public art.”
The space is created with multi-purpose spaces for the modern working environment. “The flexibility of the modern working environment really questions the role that cities play, and the workplaces within them. So what we’re trying to do with the lobby is to create spaces for informal, formal, and serendipitous interaction”
Strategic value creation
Repositioning 400 George:
Rewinding the clock to 2009, to the time of construction, the North Quarter was an emerging precinct with limited amenities. A food court was installed on Level 1 to meet tenant needs, accessed via an escalator at the building’s entrance.
Today, the precinct is thriving, with abundant amenities and major occupiers like Suncorp, KPMG, Telstra, Microsoft and Santos. This evolution has enabled the transformation of the former level 1 food court into a purpose-built wellbeing and third-space. This upgraded area now includes a boardroom, training room, 200 sqm breakout/function space, multi-faith room, and 38 additional lockers—providing flexible environments for collaboration, learning, and reflection.
Complementing this is a class-leading end-of-trip facility, designed to support active commuting and wellness. Naturally lit and ventilated, the facility features 26 showers with Smart Fixtures, 530 lockers, 200 secure bike parking spaces, touchless entry, Dyson and GHD hair tools, a wellbeing room, and a dedicated yoga/workout space.
Together, these amenities are far better aligned with the expectations of the buildings occupants. They reflect a strong commitment to tenant wellbeing and sustainability both of which are increasingly recognised as key drivers of leasing decisions. As highlighted in JLL’s Tenant Perspectives 2024, organisations are prioritising high-quality, ESG-aligned workplaces that support employee experience, operational efficiency, and long-term business goals.
With key leasing milestones on the horizon in 2025 and 2026, the timing of the lobby refurbishment is strategic. It ensures the ground floor presentation matches the quality of amenity offered throughout the building and positions the asset competitively alongside Prime Grade offerings in the area. As part of the initial upgrade phase, the now-redundant escalator has been removed to create a more prominent and inviting street-level entryway—enhancing visibility, accessibility, and overall appeal.
Importantly, the refurbishment also plays a key role in repositioning 400 George Street as a premium commercial destination within Brisbane’s North Quarter. The upgrade aligns with broader precinct improvements, including the redevelopment of Roma Street Station, further enhancing the building’s connectivity, appeal, and long-term competitiveness.
Once complete, the lobby transformation will reinforce 400 George Street’s standing as one of the leading A-Grade assets in the precinct—delivering lasting value for tenants and investors alike.
Long-term benefits
Occupancy and rental growth
The lobby refurbishment is expected to play a key role in strengthening tenant retention by enhancing the overall experience and amenity offering. By delivering a premium arrival experience and modern, flexible spaces, the upgrade positions 400 George Street as a highly attractive option for tenants seeking quality and convenience in a CBD location.
JLL’s research shows that tenants are increasingly consolidating into prime-grade buildings to meet employee experience and sustainability goals. These improvements also create the opportunity for rental uplift, driven by enhanced presentation, upgraded facilities, and the introduction of prime retail space on the ground floor1.
ESG and sustainability alignment:
400 George Street’s strong sustainability credentials—including a 5.5-Star NABERS Energy rating, 4.5-Star NABERS Water rating, and a 5.0-Star Green Star As-Built rating—continue to make it an attractive option for government and blue-chip tenants seeking environmentally responsible workplaces.
The lobby refurbishment further reinforces Cromwell’s commitment to health-focused design and urban sustainability. By integrating natural materials, enhancing access to daylight, and creating spaces that support wellbeing and social connection, the upgrade contributes meaningfully to the building’s ESG performance and long-term environmental goals.
Conclusion
The lobby refurbishment at 400 George Street is more than a facelift—it’s a strategic investment in the future of Brisbane’s commercial landscape. With visionary design and premium amenities, the project is set to elevate the building’s status and deliver long-term value to tenants and investors alike.
1JLL. Tenant Perspectives 2024. Retrieved from jll-tenant-perspectives-2024.pdf
Related posts
What’s coming for commercial property in 2025?
Santa has come and gone, prawn-induced food comas have ended, and workplaces and schools have started to hum again after the summer break……
Brisbane Fringe continues to be one of the top-performing office markets nationally, with only the Brisbane CBD and Canberra having tighter vacancy ra…
Cromwell Unveils Landmark Project and Debt Refinance
Barton, ACT development
Cromwell Property Group (ASX:CMW) (Cromwell or The Group), announced on 11 July 2025 that it has entered into an agreement for lease with a Commonwealth Government entity to develop a 19,800 sqm office building in Barton, ACT. This project marks a significant milestone in Cromwell’s new strategic growth phase.
The six-level facility, designed to achieve a 6.0-star NABERS Energy and 6.0-star Greenstar rating, will be 100% occupied by a key Commonwealth Government department under a 15-year lease with an option for a 5-year extension, providing long-term income stability. The site is located in a premier location within the Parliamentary Precinct and enables the consolidation of multiple Commonwealth tenancies into a single building, close to important counterparts and Capital Hill.
Jonathan Callaghan, Cromwell CEO commented: “While broader market conditions have made new developments challenging, this project stands out as a compelling opportunity and is a strategic step forward after the completion of our business simplification process. The project will be led by Cromwell’s skilled inhouse Development team, ensuring the delivery of a top-of-the-line facility. With a long lease to the Australian Commonwealth Government, a AAA-rated, low risk tenant, this initiative is expected to drive strong returns.”
While the project will initially be funded by Cromwell, ultimately the outstanding quality of this project, and current lack of comparable opportunities, will make this asset very attractive to future capital partners as the Group transitions to a capital light investment management model.
The anticipated total cost of the development is $201 million. This includes land, construction costs, fees, finance costs, and a tenant incentive which is commensurate with market, to be taken in instalments during the delivery of the project. The projected yield on cost is expected to be greater than 6.3%.
Debt Refinance
Further positive steps forward since completion of the sale of the European platform include the renegotiation of our bilateral debt facilities, resulting in more favourable terms plus flexible covenants and longer duration. The renegotiation has resulted in a decrease in Cromwell’s weighted average drawn credit margin from 1.77% to 1.31%. Negotiation of this improvement in Cromwell’s debt terms was supported by the significantly reduced net debt and gearing position of the Group.
Gary Weiss, Cromwell Chair commented that “The journey to simplify Cromwell’s business has taken some time. We are pleased that the focus is now shifting to deployment of the Group’s strengthened balance sheet into careful and considered growth initiatives. Our business is ready and well equipped for the next stage of our journey”.
Market outlook
The listed property sector is in good shape and provides investors with the opportunity to gain exposure to high quality commercial real estate at a discount to independently assessed values. While share market volatility may be uncomfortable at times, the offset is liquidity, enabling investors to rebalance portfolios without the risk of being trapped in illiquid vehicles.
Rising interest rates have been a headwind for many asset classes, with property, both listed and unlisted, a particularly interest rate sensitive sector. In February, the Reserve Bank of Australia made its first cut to the cash rate target since November 2020, heralding a more buoyant environment for the property sector. The February reporting season also saw stocks providing solid updates, valuation stability and an expectation of liquidity returning to the property transaction market. Long term valuations are driven by “normalised” interest costs, meaning the impact of short term hedges maturing is mostly immaterial. A second 25bp interest rate cut was delivered in May 2025. Should current expectations for further interest rate cuts eventuate, the sector should perform well.
The industrial sub-sector continues to be the most sought after, given the tailwinds of e-commerce growth, the potential onshoring of key manufacturing categories and the decision by many corporates to build some redundancy into supply chains to cope with current disruptions. All of these factors are contributing to ongoing demand for industrial space, which has been evidenced by rapidly accelerating market rents and vacancy rates at historic lows of around 2% in many markets. While rental growth has recently cooled, construction costs remain elevated making additions to supply difficult and thereby prolonging robust conditions.
We remain cognisant of the structural changes occurring in the Retail sector with the growing penetration of online sales and the greater importance of experiential offering inside malls. Recent performance of shopping centre owners has however been strong, with consumers showing resilience and share prices moving higher. It is interesting to note the juxtaposition of very high retail sales figures despite very low levels of consumer confidence, no doubt impacted by rising costs of living. Importantly, we are also now seeing positive re-leasing spreads in shopping centres, indicating strengthening demand from retail tenants.
The jury is still out on exactly how tenants will use office space moving forward, but demand for good quality well located space remains solid and there is growing momentum from companies to get staff back into the office. Leasing activity is beginning to pick up, and transactional activity is also returning, with discounts to book values materially reduced. Incentives on new leases remain elevated.
We expect to see limited further downside to asset values in office markets but elsewhere expect market rent growth to largely offset cap rate expansion, particularly in industrial assets. Listed pricing provides a buffer to such movements.
The content above is taken from the Cromwell Phoenix Property Securities Fund quarterly report. Sign up here to be the first to access the latest report and to gain a deeper insight into the Fund’s performance.
Performance commentary
Fill out the form below to view the full commentary.
Stuart Cartledge, Managing Director, Phoenix Portfolios
Market Commentary
The S&P/ASX 300 A-REIT Accumulation Index rose 13.4% over the June quarter outperforming the broader equity market, despite the S&P ASX 300 Index returning a creditable 9.5%. During the period, many of the global macroeconomic and geopolitical fears that were gripping the market somewhat dissipated, at least in terms of stock market returns.
The benchmark is dominated by Industrial heavyweight Goodman Group (GMG), which recovered strongly over the quarter, closing 21.0% higher, almost recovering to where it began 2025. The more conducive market environment also helped other property fund managers. Qualitas Limited (QAL), led the way, gaining 45.6%, despite limited company specific news. Solid residential house price growth is supportive of QAL’s business. Charter Hall Group (CHC) was also an outperformer, adding 20.1%. A more stable valuation environment and lowered macroeconomic concerns are a pleasant change for CHC’s business. Alternatively, HMC Capital Limited (HMC) was a meaningful underperformer, losing 18.1%, with ongoing issues across its healthcare property business, due to major tenant, Healthscope’s receivership process, along with a delayed settlement of a key asset that was to seed its Energy Transition business. The CEO of that business also departed HMC. It appears as if this will no longer be the growth driver for HMC, that was once anticipated.
Office property owners were underperformers in the quarter. Recently released external valuations saw limited movement for office properties, with the bulk of portfolios moving within a +/- 2% band. This was characterised by face rent growth offsetting a marginal expansion in capitalisation rates. Mixed rental data however tempered returns. Recent data showed the Melbourne CBD has had the strongest net absorption, but is facing the weakest effective rent growth, with a decline of more than 8% over the past 12 months. These stats were somewhat dominated by Coles planning a move of its head office from its current suburban location to an office building near Southern Cross Railway Station. Absorption numbers were less impressive in Sydney, however effective rents grew 10% over the year, driven by a reduction in incentives. Cromwell Property Group (CMW) lost 6.1% in the quarter, whilst Dexus (DXS) gave up 3.5%. Centuria Office REIT (COF) finished 2.2% higher and Perth-exposed GDI Property Group (GDI) rose 3.9%, still meaningfully underperforming the property index.
Shopping centre owners rose sharply in the June quarter, but still managed to underperform the index. Unibail-Rodamco-Westfield (URW) gained 12.4%, with a positive response to its investor day. Somewhat sadly for local investors, URW announced it would delist from the ASX. After a multigenerational run, this marks the end of offshore Westfield-branded shopping centres’ association with Australia. Locally, Vicinity Centres (VCX) moved 12.3% higher and domestic Westfield shopping centre owner Scentre Group (SCG) lifted 6.0%. Owners of smaller neighbourhood shopping centres also produced solid returns, with Region Group (RGN) up 9.7% and Charter Hall Retail REIT (CQR) adding 10.7%.
Uniformly positive house price growth around the country supported residential property developers during the period. Cedar Woods Properties Limited (CWP) jumped 36.6% higher, as it upgraded full year earnings guidance and restocked it land bank. Peet Limited (PPC) also outperformed, gaining 19.7%, supported by the announcement of a strategic review process. AV Jennings Limited (AVJ) rose 9.9% as it heads towards completion of its takeover. Finbar Group Limited (FRI) underperformed the index, up 0.7%, as its previously announced CEO transition occurred in June.
Market outlook
The listed property sector is in good shape and provides investors with the opportunity to gain exposure to high quality commercial real estate at a discount to independently assessed values. While share market volatility may be uncomfortable at times, the offset is liquidity, enabling investors to rebalance portfolios without the risk of being trapped in illiquid vehicles.
Rising interest rates have been a headwind for many asset classes, with property, both listed and unlisted, a particularly interest rate sensitive sector. In February, the Reserve Bank of Australia made its first cut to the cash rate target since November 2020, heralding a more buoyant environment for the property sector. The February reporting season also saw stocks providing solid updates, valuation stability and an expectation of liquidity returning to the property transaction market. Long term valuations are driven by “normalised” interest costs, meaning the impact of short term hedges maturing is mostly immaterial. A second 25bp interest rate cut was delivered in May 2025. Should current expectations for further interest rate cuts eventuate, the sector should perform well.
The industrial sub-sector continues to be the most sought after, given the tailwinds of e-commerce growth, the potential onshoring of key manufacturing categories and the decision by many corporates to build some redundancy into supply chains to cope with current disruptions. All of these factors are contributing to ongoing demand for industrial space, which has been evidenced by rapidly accelerating market rents and vacancy rates at historic lows of around 2% in many markets. While rental growth has recently cooled, construction costs remain elevated making additions to supply difficult and thereby prolonging robust conditions.
We remain cognisant of the structural changes occurring in the Retail sector with the growing penetration of online sales and the greater importance of experiential offering inside malls. Recent performance of shopping centre owners has however been strong, with consumers showing resilience and share prices moving higher. It is interesting to note the juxtaposition of very high retail sales figures despite very low levels of consumer confidence, no doubt impacted by rising costs of living. Importantly, we are also now seeing positive re-leasing spreads in shopping centres, indicating strengthening demand from retail tenants.
The jury is still out on exactly how tenants will use office space moving forward, but demand for good quality well located space remains solid and there is growing momentum from companies to get staff back into the office. Leasing activity is beginning to pick up, and transactional activity is also returning, with discounts to book values materially reduced. Incentives on new leases remain elevated.
We expect to see limited further downside to asset values in office markets but elsewhere expect market rent growth to largely offset cap rate expansion, particularly in industrial assets. Listed pricing provides a buffer to such movements.
The content above is taken from the Cromwell Phoenix Property Securities Fund quarterly report. Sign up here to be the first to access the latest report and to gain a deeper insight into the Fund’s performance.
Performance commentary
Fill out the form below to view the full commentary.
The June quarter was notable for its geopolitical instability, headlined by Israel’s strikes on Iran and the subsequent involvement of the US. While Iran’s parliament voted to close the Strait of Hormuz and impede oil supplies in retaliation, the closure has not been enforced, and Brent Crude prices are only 4% higher than a month ago1 . Tensions have cooled to some degree and economic implications have been limited, however the situation could deteriorate and affect economic growth and/or inflation in the months and quarters ahead.
The other most newsworthy events, since our last market update, occurred after the completion of the June quarter – the RBA’s July rate decision and Trump’s ‘Liberation Day 2.0’. A cautious RBA elected to adopt a “wait and see” approach, going against market pricing and economists’ expectations to keep the cash rate steady at 3.85% in a split vote (6:3). The Monetary Policy Board wanted to see more evidence that inflation is likely to stay within the target band – namely June quarter CPI (released 30 July) and June employment data (17 July). These data points will be released prior to the next RBA decision in August and, absent a shock outcome, are expected to pave the way for the third cut of 2025. The market is now expecting 64bps of cuts over the remainder of the year2.
In its decision statement, the RBA flagged elevated global uncertainty and the unknown final scope of US tariffs and associated policy responses – on this front, there has been little respite. Reciprocal tariff rates were set to come into force on 8 July (US time) following a 90-day suspension, however the pause was extended until 1 August. Adding to the complexity, Trump proposed several new tariffs in early July including a 50% tariff on copper imports, 200% on pharmaceuticals from countries with “unfair” pricing mechanisms, and 50% on all imports from Brazil. These measures do not distinguish between ally or foe, and while the announcements may be negotiating bluster, the resulting uncertainty further diminishes confidence in the US as a stable and reliable investment destination. Fortunately, the RBA has plenty of capacity to stimulate the Australian economy if this global uncertainty leads to softer domestic growth.
Fortunately, the RBA has plenty of capacity to stimulate the Australian economy if this global uncertainty leads to softer domestic growth.
Office
Analysis of JLL Research data indicates nearly 57,000 square metres (sqm) of positive net absorption was recorded across Australia’s major CBD markets in Q2 2025, marking the first quarter since 2021 where all markets saw demand for space grow. National CBD office demand has now been in positive territory for 11 of the past 12 quarters. Sydney CBD was comfortably the top performing market from a demand perspective, with 23,500 sqm of net absorption and 92,400 sqm over the last 12 months. Melbourne’s CBD benefitted from tenants centralising from Fringe markets, while the Brisbane CBD saw a number of large occupiers expand their footprint.
Despite the positive demand result, the national CBD vacancy rate edged 0.1% higher to 15.0% due to supply completions. Perth CBD saw the largest increase in total stock following Cbus/Brookfield’s completion of the premium development ‘Nine The Esplanade’. The rest of the increase in supply largely came from the Sydney CBD market, where a major refurbishment in Circular Quay and a luxury mixed use development were completed. While the vacancy rate increased in these two markets, the Brisbane and Adelaide CBDs both saw a tightening of 0.3% pts. In Canberra, the vacancy rate continues to vary significantly by precinct.
National CBD prime net face rent growth maintained its strong pace (+1.4%), taking annual growth to +6.0%. Brisbane recorded the strongest growth, reflecting the market’s low vacancy rate. Performance was also strong in the Melbourne CBD, where headline rents saw the biggest quarterly jump since 2019. Prime incentives were largely unchanged across all of the CBD markets, with Brisbane CBD (-0.3% pts) and Canberra (+0.3% pts) seeing the biggest movements. This resulted in effective rents – headline rents adjusted for incentives – growing most strongly in Brisbane and Melbourne.
Transaction volume fell to $0.9 billion for the quarter, representing the second-lowest June quarter result since the start of the data series (2007). The weak volume figure was due to a lack of major assets changing hands – the largest transaction this quarter was c$290 million, compared to more than $600 million last quarter. However, on a number of deals basis, this quarter saw more activity than last quarter. From a market perspective, Sydney CBD comprised the greatest share of national volume, while the Brisbane Fringe was the only market where volume exceeded the 10-year average.
There was further evidence that the office valuation cycle is at, or close to, the bottom. Average prime yields were unchanged in every CBD market except Brisbane, where a slight expansion of 6.5bps was recorded.
Getting a read on the strength of the consumer has become more challenging over recent months, with Cyclone Alfred (March), and the unusual timing of the Easter/Anzac Day long weekends both introducing some noise in the data. Purchases of winter clothing supported growth in the most recent monthly data (May), however the pace of growth continues to lag expectations. With the RBA choosing to remain on hold, the drag of consumer pessimism may persist a while longer.
Positively for retail real estate, the biannual vacancy rate was largely unchanged over the last six months. Regional shopping centres saw vacancy decrease from 1.6% to 1.5%, while Neighbourhoods saw a significant decrease of 0.8% pts from December to June. These improvements were offset by a large increase in vacancy rate across the Sub-Regional centre type. From a market perspective, conditions tightened across every centre type in Sydney, while Melbourne was the main driver of higher Sub-Regional vacancy.
Supply remains muted with only 13,600 sqm of Neighbourhood space added to national core retail stock over the quarter. The limited supply pipeline is supporting retail fundamentals, however rents were largely unchanged over the latest quarter. On an annual basis, growth has been strongest in S.E. Queensland.
Retail transaction volume strengthened again over the quarter to total $2.4 billion. The resulted was buoyed by the Neighbourhood sub-sector which recorded its second biggest quarter of deal volume in history at just over $860 million. The elevated volume was skewed by the $450 million sale of St Ives Shopping Village, an unusually large transaction which included some adjoining residential properties and presents development potential. Large Format Retail continued to record elevated deal volume, with significant single tenant assets such as IKEA, Costco, and Bunnings, comprising the majority of this quarter’s activity.
Sub-Regional yields compressed across every market except S.E. Queensland. This centre type has seen the biggest recovery in yields since pandemic highs, and pricing is now approaching pre-COVID levels. Neighbourhood yields also decreased in Perth, while there was no movement across the Regional shopping centre type.
Occupier take-up (gross demand) was in line with last quarter at nearly 800,000 sqm. Transport & Warehousing was the main driver of the result with over 300,000 sqm of gross demand recorded. It was also a solid result across Retail & Wholesale Trade, with demand underpinned by Kmart’s preleasing of a new major distribution centre at Sydney’s Moorebank Intermodal Precinct. This leasing deal contributed to Sydney demand outpacing its five-year average and comprising nearly 40% of national take-up. Perth was the only other market to outperform recent history, with a number of occupiers expanding into larger premises.
Rent growth slowed significantly over the quarter with 16 of 22 markets staying unchanged compared to March. All precincts across Sydney and Perth were flat, while the South East was the only sub-market in Melbourne where rents grew (+0.6%). Adelaide also only had one precinct record growth, the Outer North, which was the top performer nationally (+3.3%). Adelaide has comfortably been the top performing market over the last 12 months, but it was Brisbane that topped the growth charts in June with average growth across its three precincts rising to 1.8%. There was a slight increase in prime incentives in select markets along the East Coast.
Just over 800,000 sqm of supply was completed over the quarter, around 30% more than the quarterly average of the past five years. While supply was below average in Melbourne and Perth, Adelaide saw its second largest quarter of development in history. There is currently nearly 950,000 sqm of space under construction and due to complete in 2025. Even if all of these projects are delivered on time, 2025 will see the lowest level of new supply since 2021. Additionally, actual delivery may slip into subsequent periods given construction delays are persisting.
Industrial transaction volume strengthened after last quarter’s unusually soft showing, totalling over $2.4 billion across 90 deals. Brisbane was a standout as Chinese e-commerce giant JD.com made its first industrial investment in Australia – the Wacol Logistics Hub – for around $250 million. Adelaide also saw elevated transaction activity with the dollar volume running 33% higher than the quarterly average of the past five years. Strong demand for Brisbane assets was reflected in market yields, which compressed by 12-20bps across its three precincts. Perth saw the largest movement in yields with every precinct compressing 25bps, while Sydney and Adelaide also recorded some instances of compression.
Sign up to Insight Magazine
Stay informed about investing strategies, finance news, property market updates, and more by signing up for Insight. Build a solid foundation of investment knowledge to help you make the right investment decisions and guide you in planning your investment journey.
The global economy moved from alert to alarmed when higher-than-expected tariffs were announced in early April. While the ultimate trajectory of trade policy remains a key uncertainty, market anxiety has eased somewhat in recent months as Trump has signalled a readiness to back down if economic conditions deteriorate too sharply. Economists now expect the worst-case scenarios to be avoided, however growth is forecast to be weaker than if trade destabilisation had not occurred.
Australia is somewhat insulated from the impacts of global volatility. Most attention domestically is focused on the RBA and its willingness to stimulate the economy. Growth green shoots were seen in 2024, but momentum has slowed, particularly in consumer-oriented sectors. If a more supportive monetary policy environment is not delivered soon, the transition of the economy from public sector demand to private business investment may become bumpy.
The commercial property market continues to stabilise, with improving sentiment evident in both capital flows and leasing fundamentals. Office appears to have reached an inflection point, while retail and industrial pricing continues to firm. As confidence returns to the asset class and institutional capital re-engages, identifying compelling opportunities will increasingly depend on a deep understanding of asset quality and positioning.
How did the Cromwell Funds Management fare this quarter?
Cromwell Direct Property Fund (DPF, the Fund)
The entire DPF portfolio underwent a valuation in advance of the Fund’s Liquidity Event. Compared to prior valuations completed between June and October 2024, the six directly held assets fell by 0.60%. Two assets saw an uplift and one remained flat, primarily due to strong rental growth across Queensland markets.
Considering DPF’s partial ownership of Energex House in Brisbane (Cromwell Riverpark Trust), and the ATO building in Dandenong (Cromwell Property Trust 12), the total change was just 0.90%. Energex House remained flat, while the ATO building declined by 13%, attributed to a 1% increase in the capitalisation rate. This adjustment was made by the independent valuer based on comparable sales evidence in the Melbourne office market.
As at 30 June, DPF’s portfolio, now valued at $537.2 million on a look-through basis, is 96.6% occupied with a weighted average lease expiry of 3.4 years.
Most assets within the DPF portfolio are multi-tenanted buildings, with a significant concentration located in Brisbane. In the current market, particularly in Brisbane, we continue to observe strong effective rental growth. The portfolio’s shorter Weighted Average Lease Expiry (WALE) presents a strategic advantage, enabling the Fund to capitalise on rental reversion opportunities as leases expire and are renegotiated.
This staggered lease expiry profile allows space to be progressively repriced to current market rates, supporting earnings growth. Additionally, the shorter WALE provides flexibility to reposition assets and attract higher-paying tenants, further enhancing the portfolio’s income potential and long-term value.
Just under half of the gross passing income is derived from Government and Listed companies or their subsidiaries. Cromwell’s asset management team have negotiated over 10,000sqm of leasing this financial year across 23 transactions, with several larger deals currently in advanced stages of negotiation. The largest completed deals occurred at 545 Queen Street in Brisbane, including a 6-year lease on over 2,100sqm to a new tenant, and a 2-year lease extension on 1,600sqm to an existing Federal Government tenant.
Cromwell Property Trust 12 (C12)
Cromwell Property Trust 12 is nearing the end of its second term in October this year. In September, investors in C12 will receive a Notice of Meeting and Explanatory Memorandum, which will propose an extension of the Fund’s term through to December 2027. The Explanatory Memorandum will contain market data and commentary to help investors decide whether they wish to extend the trust term or take the asset to market. The ATO building remains 99.3% leased, with only minor ground floor vacancy and a WALE of 5.1 years. Since its inception in 2012 with an initial portfolio of three assets, C12 has delivered strong performance. Despite recent valuation adjustments, the Fund has achieved an equity internal rate of return (IRR) of approximately 11.7%, reflecting its long-term success.
Footnotes
Cromwell analysis of MarketWatch data (9 July)
ASX (8 July)
About Cromwell Direct Property Fund
Read more about Cromwell Direct Property Fund, including where to locate the product disclosure statement (PDS) and target market determination (TMD). Investors should consider the PDS and TMD in deciding whether to acquire, or to continue to hold units in the Fund.
The S&P/ASX 300 A-REIT Accumulation Index gave back some of the gains seen in the previous quarter, dropping 6.1%. Property stocks underperformed …
We often showcase the impressive results of office fitouts conducted by Cromwell within our assets, which help secure rental income by driving tenant retention and attracting new tenants. But what does the fitout process actually involve? Cromwell combines a unique blend of tenant focus and expertise, backed by a strong track record of managing and delivering complex refurbishments and integrated tenant fitouts. We collaborate with multiple stakeholders to ensure projects are completed on time, within budget, and to the highest specifications.
In this edition, we sit down with the architects from Gray Puksand, along with our dedicated Development and Leasing teams, to delve into the processes behind the Cromwell office fitout. Cromwell occupies two floors in the Cromwell Direct Property Fund’s 100 Creek Street asset in Brisbane.
What were the initial steps involved in a fitout project?
Brendan Sim, Cromwell Development Manager: We begin our fitout projects by thoroughly understanding the tenant or prospective tenants’ requirements through a series of meetings and workshops. In this case, the tenant, Cromwell wanted a post-COVID workspace that was comfortable, inclusive, functional and timeless to minimise need for future refurbishment. Key requirements included fostering in-office collaboration, creating areas for different types of work, ensuring accessibility and incorporating sustainable practices. Flexibility for future growth and reconfiguration was also essential.
With these requirements in hand, we created a comprehensive project brief and conducted a competitive design and construct tender process, ensuring that the selected contractor had the expertise to meet both budgetary and sustainability goals. Gray Puksand was chosen as the architect. From there, we collaborated closely with both contractors to refine the design, ensuring it met all the tenants needs and goals. This collaborative approach is crucial to efficiently addressing challenges and ensuring a fitout project’s success.
Since 2010, Cromwell has applied the Soft Landings Framework to ensure long-term performance and tenant-focused outcomes. This framework involves engaging stakeholders to critically appraise design and construction, delivering solutions that meet user needs and provide support through all phases of use. Key consultants, contractors, and suppliers commit to an aftercare plan beyond project completion, ensuring ongoing responsibility and interest in the project’s success.
How did you integrate a new way of working into the design?
Maria Correia, Gray Puksand: In answer to the brief, we introduced the “Cromwell Lifestyle” concept. This concept embodies a curated experience that connects people, spaces, and technology, promoting community, wellbeing, and learning. Central to our approach was a deep understanding of Cromwell’s post-COVID needs and values.
The inclusion of native plants, natural light, and a light colour palette created a sense of place that felt authentically Queensland. We addressed diverse user needs by incorporating varied settings, such as collaborative zones, focus rooms, a sunroom, a library, wellness rooms, and a multifaith room. This allows staff to find spaces that suit their work styles, enhancing productivity and comfort.
The emotional aspect of our design drew inspiration from residential and hospitality spaces, creating environments that felt special and encouraged staff to engage. By blending functional and emotional elements, we crafted a workspace that not only met but exceeded the brief, fostering a strong sense of belonging and culture among staff.
By blending functional and emotional elements, we crafted a workspace that not only met but exceeded the brief, fostering a strong sense of belonging and culture among staff.
What were the key challenges and successes of the project?
Brendan Sim, Cromwell Development Manager: We are proud of our track record of delivering projects on time, to scope and to budget. Despite having four separate contractors working simultaneously within the building, we delivered the project under budget and handed it over early.
Cromwell is a strong believer in integrating ESG principles into every aspect of our operations. With this project, we aimed to create a pinnacle example of what we can achieve on behalf of tenants and are proud to have met an extensive list of goals.
We prioritised reuse and refurbishment wherever possible to reduce fitout costs, waste and embodied carbon, recycling 92 workstations and 132 desk chairs from our existing fitout and purchasing second-hand desks and chairs from marketplace for focus rooms. The existing intertenancy staircase was refurbished and reclad. We achieved a 96% waste diversion from landfill, including the removal of the existing fitout to make way for the Cromwell fitout and ensured a fully electric site with no use of fossil fuels.
We understand that ESG encompasses more than just environmental impacts. We achieved a 50:50 gender diversity across the project delivery team and 3.75% First Nations procurement based on contract value. Furthermore, 84% of the work was completed within 7 am – 5 pm, Monday to Friday, which is more socially sustainable for people working on-site.
Maria Correia, Gray Puksand: Sustainability was a cornerstone of the project. We used climate-positive materials and implemented energy-efficient LED lighting with sensors. Cradle-to-cradle certified carpets and refurbished workstations extend the workspace’s lifecycle, contributing to a regenerative circular economy. Our approach ensures durability, easy repair, and repurposing, reducing costs and waste.
How do you optimise a fitout design?
Brendan Sim, Cromwell Development Manager: When creating a fitout, we focus on using the space effectively. This is obviously important to a tenant so that they can get the most out of a space. For example, in the Cromwell fitout we transformed what would be a “dead” space – the back of house corridor – into a functional locker and storage area. We placed all meeting rooms and focus rooms at the buildings core, while positioning office desks, where staff would spend most of their time, around the perimeter of the space to ensure ample natural light throughout the day. Modularity throughout the fit-out design was a clear focus. This will allow meeting rooms or break out spaces to be amended efficiently to accommodate workstations pods or other break out spaces as the requirements of the business evolve over time, giving Cromwell the ability to grow within the current floorplate.
Maria Correia, Gray Puksand: As we move to the AI workplace and the uncertainty of what that will bring, prioritising the ‘human’ component of the workplace will be critical. The design acknowledges the diverse needs of the workforce, recognising that individuals have varying working styles and preferences. The workplace settings at Cromwell are thoughtfully designed to encourage collaboration and inclusivity, providing spaces for socialising and connecting. Additionally, areas like the library, sunroom, wellness room, multifaith room, and focus rooms cater to individual needs, offering retreats for focus and relaxation.
What are the current trends and cultural shifts in the office landscape, and how are these influencing your designs?
Maria Correia, Gray Puksand: Cultural shifts in workspace design have evolved significantly over the past few decades, driven by changes in work practices, technology, employee preferences, and broader societal trends. There are several trends emerging some of which we have integrated into the Cromwell workspace however with the rise of the AI workplace, I think moving forward it would be good to focus on the ‘human centric’ workplace trends outlined below.
Health and Wellness Focus
With the rise of workers health and wellbeing due to the stresses of work and the sedentary nature of desk work more and more business are embracing designs that prioritise employee health and wellness, including features like ergonomic furniture, biophilic design (integrating nature into the workspace), natural light, and spaces for relaxation. We integrated this design trend throughout the Cromwell workspace.
Employee-Centred Design
Employee feedback is increasingly being sought to shape workspace design. Cromwell undertook an extensive amount of consultation with their users to arrive at the brief. We then conducted some informal group interviews to further understand user’s needs. This “user-centric” approach allowed us to all consider the preferences, needs, and behaviours of employees, fostering a sense of ownership and satisfaction. This collaborative design process informed our design approach to create open spaces for group gatherings e.g. breakout / town hall and quieter more intimate social spaces e.g. library.
Work-Life Integration
Work-life balance was often viewed as a separate concept from work, with offices being places where work and personal life were strictly separate. Modern workspace designs are focused on work-life integration, offering amenities that make the office a more comfortable and accommodating place to work, such as wellness rooms, daycare facilities, or even spaces for socialising. Our Concept of ‘The Cromwell Lifestyle’ begins to bring to life this Work-life integration to help users balance personal and professional responsibilities, leading to higher job satisfaction and engagement.
How does the fitout help with leasing activity at 100 Creek?
Stephen Rutter, Cromwell National Manager Project Leasing: We tailor our leasing strategy to each building by listening to tenants, staying attuned to market trends, and developing spaces accordingly. At 100 Creek Street, our approach includes a mix of cold shells, warm shells, and speculative fitouts when marketing spaces for lease.
Cold Shell: A blank canvas that allows tenants to customise the space to their specific needs.
Warm Shell: Provides a head start with some basic infrastructure in place.
Speculative Fitout: A plug-and-play solution, ideal for tenants without a dedicated team to manage a new fit-out, making it easier for them to move into a new tenancy.
The fit-out has significantly enhanced the appeal of 100 Creek Street. We walk prospective tenants through the space to showcase the building’s flexibility and the high-quality office fit-outs that can be achieved.
The fit-out serves as an excellent example for prospective tenants interested in cold shell spaces, demonstrating the transformation from a blank canvas to fully functional offices that meet modern working demands. This project has set a new benchmark for office spaces in the area. Combined with the Business Hub, an important facility for tenants—particularly small-to-medium tenants—who wish to use boardroom or training facilities but don’t have access to these as part of their own tenancy, and the local amenities, it makes 100 Creek Street a highly desirable location.
As of March 30, 2025, 100 Creek Street boasts a 94.2% occupancy rate.
Related posts
What’s coming for commercial property in 2025?
Santa has come and gone, prawn-induced food comas have ended, and workplaces and schools have started to hum again after the summer break……
Brisbane Fringe continues to be one of the top-performing office markets nationally, with only the Brisbane CBD and Canberra having tighter vacancy ra…
Cromwell’s green trifecta for 6-star NABERS Energy ratings
Cromwell is proud to announce significant achievements in sustainability with three more assets across our portfolios recently achieving a 6.0-star NABERS Energy rating: 540 Wickham Street in Fortitude Valley, 420 Flinders Street in Townsville, and 19 George Street in Dandenong.
NABERS (National Australian Built Environment Rating System) offers reliable and comparable sustainability measurements across various building sectors. In Australia, a NABERS Energy rating is mandatory for office buildings over 1,000 square metres being sold or leased, with 6.0-stars being the highest achievable rating. Achieving a high NABERS rating is not just a regulatory requirement but a mark of excellence in environmental performance. Top-rated NABERS buildings are highly sought after by blue-chip and government tenants, underscoring their value and desirability. These ratings signify a commitment to sustainability, leading to significant cost savings, enhanced marketability, and a positive environmental impact.
Our property team continually explores ways to optimise energy efficiencies and future-proof our assets to allow us to continue to deliver financial returns for investors while reducing environmental impacts. This proactive approach ensures that our buildings meet the highest standards of sustainability, as evidenced by our recent 6.0-star NABERS Energy ratings.
HQ North, 540 Wickham Street, Fortitude Valley
The team has been continuously optimising our HQ North asset through various initiatives. Following the decommissioning of the gas-fired power cogeneration facility at HQ North in FY23, the operational building’s gas usage for 2024 has dropped 98%, now limited to hot water units for the End-of-Trip facilities and bathrooms.
In November 2023, we installed a 158kW capacity solar PV system, which now meets approximately 15% of the building’s annual electricity demand. Additionally, by optimising the building management system, upgrading to LED lighting in common areas, and switching to GreenPower in January 2024, we have achieved a 66% reduction in scope 2 emissions.
These combined, continuous improvement efforts have earned HQ North a prestigious 6.0-star NABERS Energy rating. We continue to seek efficiencies for the asset with the electrification of the domestic hot water units currently under review. Timing for their replacement is dependent on budget planning and a holistic evaluation of the embodied carbon across the units’ life cycle to ensure the most sustainable long-term outcome.
19 George Street, Dandenong
Similarly, the recent investment in a 100kW capacity solar PV at 19 George Street, Dandenong, is already yielding results, accounting for 9.4% of total site energy. As the system was installed partway through the year (operational for 7 months), this figure does not yet represent its full-year performance. The solar generation has helped reduce reliance on grid electricity and supported lower operational emissions and energy costs. Together with 100% accredited GreenPower, the site achieved 55.3% renewable energy use and a 6.0-star NABERS Energy rating.
Part of the Cromwell Direct Property Fund portfolio, and tenanted by a government organisation, this achievement underscores Cromwell’s commitment to sustainability and energy efficiency across both our funds and investment portfolios.
The building’s onsite solar generation plays a key role in supporting the tenant’s net zero by 2030 target, by reducing emissions associated with its tenancy. While these are considered Scope 3 emissions for the tenant, they contribute to lowering the environmental impact of leased space, a growing focus in government sustainability strategies. Cromwell’s use of 100% accredited GreenPower complements the onsite solar, further reinforcing our commitment to providing low-carbon, future-ready assets for government tenants.
420 Flinders Street, Townsville
The final asset to achieve the upgraded 6.0-star NABERS Energy rating is another Cromwell Direct Property Fund asset, 420 Flinders Street, Townsville, with 99.3% of the building’s energy now sourced from renewables. This result was supported by a strategic investment in a 39.9kW onsite solar PV system, which contributes 6.2% of the site’s total energy.
Installed in mid-2024, the system’s current performance does not yet reflect a full 12 months of operation. Despite installation challenges due to weather and structural constraints, it has delivered strong early results. Alongside 100% accredited GreenPower, the investment has significantly reduced the building’s operational emissions.
Cromwell’s commitment to sustainable excellence
Cromwell now has six assets with 6.0-star NABERS Energy ratings and six assets with 5.5-star Energy ratings within its fund and investment portfolios demonstrating our dedication to optimising our assets pushing the boundaries of what is possible in sustainable building practices. Our lowest Energy rating is a 5.0-stars, reflecting our high standards and commitment to excellence.
Related posts
What’s coming for commercial property in 2025?
Santa has come and gone, prawn-induced food comas have ended, and workplaces and schools have started to hum again after the summer break……
Brisbane Fringe continues to be one of the top-performing office markets nationally, with only the Brisbane CBD and Canberra having tighter vacancy ra…
Stuart Cartledge, Managing Director, Phoenix Portfolios
Market Commentary
The S&P/ASX 300 A-REIT Accumulation Index fell 6.6% over the March quarter under-performing the broader equity market, despite all the geopolitical tensions gripping investors’ minds.
The benchmark is dominated by Industrial heavyweight Goodman Group (GMG), which performed poorly over the quarter, closing down just over 20%. For more on GMG, see the Performance Commentary section of the latest quarterly report. Sticking with the Industrial sub-sector, while a very different investment proposition to GMG, recently listed DigiCo REIT, with its focus on digital infrastructure including data centres was also a very weak performer, down 32.6%. There is little doubt around the demand for ever increasing data centre capacity, but we also expect a significant supply response around the world, and like all things technology related, making long term forecasts is difficult. Anchored by more traditional industrial sheds, both Dexus Industria REIT (DXI) and Centuria Industrial REIT (CIP) posted positive returns of 2.0% and 3.6% respectively. CIP comprises 87 high quality assets, located in core urban infill markets and delivered like-for-like income growth of 6.4% for the first half of the 2025 financial year. The stock is benefitting from striking new leases at material premiums to expiring leases. That premium averaged 50% for the 7% of the portfolio that re-leased during the 6 months to December 2024. CIP closed the quarter at a 25% discount to its underlying book value and is well held in the Fund.
Office property owners saw a rebound from the very weak December quarter, with Dexus (DXS) up 6.3%, Centuria Office REIT up 4.6% and Mirvac Group (MGR), which holds an office-heavy investment portfolio up 11.5%. Other office names were more subdued with Abacus Group (ABG) and Cromwell Property Group both posting less than 1% falls. There is growing chatter, along with some fundamental improvements in office metrics, that the turning point in office markets is close. Depending on your perspective, it seems that owners of quality prime assets such as MGR are in the “flight to quality” camp, while owners of a wider range of office assets point to a “flight to value”. Phoenix has a blend of exposures to the office sector but is predominantly in the young and prime end of the market where cashflows look strongest.
Among the larger style shopping centre owners, Unibail-Rodamco-Westfield (URW), which owns Westfield branded centres in the USA, UK and continental Europe rose 10.3%. URW has a December year-end, so the results announced in February were for the full year. Tenant sales were up 4.5% and footfall up 2.6% over the prior year. The company also made a somewhat surprising announcement to retain its exposure to its US assets, having previously indicated a “radical reduction” in that geography. Scentre Group (SCG), owner of the domestic Westfield-branded malls, did less well and posted a small positive return for the quarter. Interestingly, SCG is looking to rezone many of its vacant land sites around its malls, having already received rezoning approval at Westfield Hornsby in Sydney and Westfield Belconnen in Canberra that now provides the opportunity for large scale residential development at both sites. Vicinity Centres (VCX) and Charter Hall Retail REIT produced solid returns over the quarter, up 7.6% and 13.7% respectively.
Property fund managers showed huge variation in outcomes over the quarter. Aside from GMG referred to elsewhere, Qualitas Limited (QAL) which focuses largely on real estate debt products, closed down 12.2%, Centuria Capital closed down 10.4%, while at the other end of the spectrum was Charter Hall Group (CHC) which closed up 12.8%. With asset values stabilising, and strong inflows via the wholesale partnerships channel, CHC upgraded guidance for the full year and now expects to deliver earnings growth of approximately 7%.
Market outlook
The listed property sector is in good shape and provides investors with the opportunity to gain exposure to high quality commercial real estate at a discount to independently assessed values. While share market volatility may be uncomfortable at times, the offset is liquidity, enabling investors to rebalance portfolios without the risk of being trapped in illiquid vehicles.
Rising interest rates have been a headwind for many asset classes, with property, both listed and unlisted, a particularly interest rate sensitive sector. In February, the Reserve Bank of Australia made its first cut to the cash rate target since November 2020, heralding a more buoyant environment for the property sector. The February reporting season also saw stocks providing solid updates, valuation stability and an expectation of liquidity returning to the property transaction market. Long term valuations are driven by “normalised” interest costs, meaning the impact of short term hedges maturing is mostly immaterial. Should current expectations for further interest rate cuts eventuate, the sector should perform well.
The industrial sub-sector continues to be the most sought after, given the tailwinds of e-commerce growth, the potential onshoring of key manufacturing categories and the decision by many corporates to build some redundancy into supply chains to cope with current disruptions. All of these factors are contributing to ongoing demand for industrial space, which has been evidenced by rapidly accelerating market rents and vacancy rates at historic lows of around 2% in many markets. While rental growth has recently cooled, construction costs remain elevated making additions to supply difficult and thereby prolonging robust conditions.
We remain cognisant of the structural changes occurring in the Retail sector with the growing penetration of online sales and the greater importance of experiential offering inside malls. Recent performance of shopping centre owners has however been strong, with consumers showing resilience and share prices moving higher. It is interesting to note the juxtaposition of very high retail sales figures despite very low levels of consumer confidence, no doubt impacted by rising costs of living. Importantly, we are also now seeing positive re-leasing spreads in shopping centres, indicating strengthening demand from retail tenants.
The jury is still out on exactly how tenants will use office space moving forward, but demand for good quality well located space remains solid and there is growing momentum from companies to get staff back into the office. Leasing activity is beginning to pick up, and transactional activity is also returning, with discounts to book values materially reduced. Incentives on new leases remain elevated.
We expect to see limited further downside to asset values in office markets but elsewhere expect market rent growth to largely offset cap rate expansion, particularly in industrial assets. Listed pricing provides a buffer to such movements.
The content above is taken from the Cromwell Phoenix Property Securities Fund quarterly report. Sign up here to be the first to access the latest report and to gain a deeper insight into the Fund’s performance.
Performance commentary
Fill out the form below to view the full commentary.
Events of the March quarter have been completely overshadowed by President Trump’s Rose Garden address on 2 April where he announced a universal 10% tariff would be applied to all US imports from 5 April, with higher tariffs to be applied from 9 April against countries with trade surpluses with the US. Taking the measures as announced, the US’s effective tariff rate is expected to increase to around 25%, a level last seen in the early 1900s2.
In the near-term, a key impact to markets and the economy is heightened volatility and uncertainty. Indeed, product exemptions and a 90-day pause on the higher tariff rates (excluding China) have already been announced. While one of Trump’s stated objectives is to incentivise investment into US manufacturing, it will be challenging for companies to commit substantial capital and resources when the landscape could shift significantly by the time these words go to print, let alone the several years which would be required to reorganise supply chains and build facilities.
Equity and bond markets have seesawed as the prospect of stagflation – higher inflation and lower growth – shakes confidence. Positively for Australia, we’re better positioned than most to weather the storm. On the whole, direct trade impacts should be limited given the US only accounts for 4% of Australian exports3. Indirect impacts via a weaker Asian economy are a risk, and the extent of policy support in China will be closely watched. The floating Australian dollar is acting as a shock absorber, depreciating in value and enhancing the attractiveness of our key commodity exports.
Economic conditions at home are also in good shape. The labour market is healthy without being so tight as to cause inflationary wage pressures, the public sector is in a position to provide supportive spending if needed, and the RBA has scope to stimulate the economy via monetary policy. In February, the RBA made its long-awaited first interest rate cut, reducing the official cash rate to 4.1%. Looking ahead, National Australia Bank (NAB) expects further easing, forecasting a 50bps cut in May, followed by 25bps reductions in July, August, and November—potentially taking the cash rate to 2.85% by year-end. Other major banks predict a slightly slower pace, but all anticipate a more supportive interest rate environment, which bodes well for increased transactional activity and continued market recovery.
Looking ahead, National Australia Bank (NAB) expects further easing, forecasting a 50bps cut in May, followed by 25bps reductions in July, August, and November—potentially taking the cash rate to 2.85% by year-end.
Office
Analysis of JLL Research data indicates nearly 44,000 square metres (sqm) of positive net absorption was recorded across Australia’s major CBD markets in Q1 2025, marking the fifth consecutive quarter of space demand growth. The composition of demand was different from previous quarters, with Brisbane CBD the only market to contract and Melbourne CBD the top performer. This was the first time since early 2019 that Melbourne recorded the strongest growth in net demand, with the result underpinned by Coles’ 30,000 sqm centralisation from Hawthorn East into Docklands. Notably, this quarter also saw the largest gap in space demand between large4 and small occupiers nationally since before the pandemic, with large occupiers leading the way. Again, this was underpinned by leasing activity in Melbourne CBD.
The positive demand result and limited supply completions combined to lower the national CBD vacancy rate from 15.2% to 14.9%. Melbourne CBD was the big winner, with vacancy tightening by 1.2%pts. Sydney CBD vacancy also decreased, with every precinct except the Western Corridor tightening. Softer demand over the quarter led to Brisbane CBD’s vacancy rate rising, however it remains lower than the long-term average. The increase in Brisbane was driven entirely by Secondary grade stock – Prime vacancy remained at 7.3% and is below the long-term average, while Secondary vacancy increased by 0.8%pts. Canberra maintained its position as the tightest market in the country, however the vacancy rate did increase due to the completion of a new A grade development.
National CBD prime net face rent growth (+1.9%) accelerated over the quarter, taking annual growth to +5.6% which is its strongest pace since early 2018. While face rents in Perth and Adelaide were unchanged, all of the other CBD markets recorded quarterly growth well in excess of the long-term average. Prime incentives decreased in the Sydney CBD Core as some Premium assets recorded strong leasing outcomes. As a result, Sydney CBD Core delivered its strongest net effective rental growth since 2017 and the best outcome across the major CBDs. Incentives also declined slightly in Brisbane CBD, ensuring effective rental growth stayed in double-digit territory on an annual basis. Elevated vacancy in Melbourne CBD continued to put upwards pressure on incentives, dragging effective rental levels lower.
Transaction volume fell to $1.4 billion after a solid final quarter of 2024. Sydney CBD maintained its position as the top preference for capital, accounting for 73% of activity. Offshore capital was active again, with Japanese investor Daibiru making the largest acquisition of the quarter (135 King St). The trajectory of deal flow in Sydney will be watched closely over coming quarters, given it tends to act as a bellwether for the capital market cycle. Activity in Melbourne was very muted, weighed down by weaker property fundamentals and associated investor cautiousness. Average prime yields were unchanged across every CBD market and most non-CBD markets.
Sign up to Insight Magazine
Stay informed about investing strategies, finance news, property market updates, and more by signing up for Insight. Build a solid foundation of investment knowledge to help you make the right investment decisions and guide you in planning your investment journey.
Retail sales growth has improved from the lows of 2023-24 but is yet to kick up materially. The tailwinds of moderating inflation, lower interest rates, and government cost-of-living supports are competing against a pessimistic and cautious consumer. While confidence was improving through the first quarter of the year, tariff uncertainty has now dampened sentiment.
Amidst stable demand, supply remains very constrained. There were only 13,000 sqm added to national core retail stock over the quarter, comprising two greenfield Neighbourhood centres servicing new housing estates. Muted supply has supported retail space market fundamentals and rental growth over the past year. While rents were largely unchanged across Regional and Sub-Regional centres this quarter, Neighbourhood centres recorded solid growth of 0.4% led by Sydney and Perth.
While retail transaction volume fell compared to last quarter, the $1.6 billion of deals done represented the second-strongest March quarter result in the history of the data series (back to 2007). The strong outcome was largely driven by large format retail and Regionals, with solid support from Sub-Regionals. Centuria’s acquisition of Logan SuperCentre ($115 million) was the dominant large format trade, while Northland Shopping Centre and Cockburn Gateway comprised the Regional deals. Northland was notable in being Victoria’s largest retail transaction since 2018.
This quarter provided further evidence that the cycle has started to turn for the retail sector. Regional shopping centre yields compressed in every market, while Sub-Regional yields compressed in every market bar Sydney.
Occupier take-up (gross demand) continued to hold up, totalling just under 800k sqm which was the strongest March quarter in three years. While Transport, Postal & Warehousing, Manufacturing, and Retail & Wholesale Trade remained the top three industries from a demand perspective, it was the smaller and more volatile industries such as Professional Services, Mining, and Construction which experienced the strongest increase in demand relative to historical levels. Sydney recorded the highest level of gross space demand, headlined by Aldi’s pre-lease of an 87,000 sqm cold storage facility which is due to complete in 2027. The precinct this site is located in, Sydney Outer Central West, accounted for 37% of national demand and 86% of Sydney demand over the quarter.
Rent growth remains above the long-term average despite a weakening of demand relative to supply. Growth was more broad-based than last quarter, with face rents increasing in 17 of 22 precincts. The smaller markets of Adelaide and Perth recorded the strongest rental growth over the quarter, with Adelaide providing all of the top three precincts. Prime incentives continued to nudge higher across the east coast and Perth, reflecting a more competitive leasing environment.
Supply completions over the quarter were concentrated in Melbourne, as has generally been the case over the past five years. The West precinct was again the main provider of new space, however Melbourne South East was not far behind. It was a particularly muted quarter for development in Sydney, with only 43k sqm reaching completion versus the five-year quarterly average of more than 170k sqm. While a substantial pipeline of 1.5 million sqm remains under construction and due to complete in 2025, actual supply delivered may prove to be spread out over a longer horizon given projects continue to be delayed.
Industrial transaction volume fell below the quarterly average of the last five years as no major portfolio deals occurred. While Sydney accounted for the largest share of transactions by dollar value, Brisbane was the most active market compared to its historical average. Despite a relatively quiet quarter of dealmaking, there are signs the valuation cycle is starting to turn for industrial. Sydney, the bellwether market, recorded yield compression across most precincts.
Outlook
Where the global economy lands as a result of trade protectionism will depend on the duration barriers are in place, the extent of any retaliatory measures, and outcomes of trade negotiations. The situation is shifting on a daily basis, and the resultant uncertainty is having a dampening effect on economic activity.
While Australia is less exposed to the economic consequences than many other countries, there is a risk that growth weakens, and this could soften leasing demand in the near-term as companies take a cautious approach to investment and expansion. In this kind of environment, high-quality assets providing stable income from blue chip, resilient tenants are desirable.
Increased uncertainty may also affect liquidity in commercial property capital markets. Positively, Australia’s standing as a stable and reliable investment destination offering attractive returns has arguably been enhanced over the past month, and this could support acquisition activity from offshore capital. During this period of heightened volatility, focusing on underlying property fundamentals and sticking to a long-term strategy should hold investors in good stead.
Cromwell Direct Property Fund – March 2025 Quarterly Update
Below is the latest quarterly update for the Cromwell Direct Property Fund (the Fund), where we share key developments, portfolio performance, and what’s coming up in the months ahead.
The Fund’s next Liquidity Event—its Periodic Withdrawal Opportunity—is proposed to commence in July 2025. Investors will receive an information pack in May, which will include market commentary and helpful insights to support your decision on whether to redeem some or all of your investment or remain invested as the market enters the recovery phase.
The Liquidity Event is designed to occur every five years, although the timing can be adjusted under certain circumstances. Under the current indicative timetable, investors will be able to submit withdrawal requests between 1 July and 5pm (AEST) on 31 July 2025.
For Unitholders who invest directly in the fund, requests must be submitted to our registry provider, Boardroom Pty Limited, using the specific Withdrawal Request form which will be provided to you via email, and uploaded to the Fund’s webpage, before the Notice Period commences.
For indirect investors, please consult your Adviser or IDPS operator who will submit requests on your behalf5.
Requests must be submitted to our registry provider, Boardroom Limited, using the specific form included in your information pack and available on the Fund’s webpages.
Redemptions will be processed in accordance with the Fund’s rules and may be funded through a mix of new capital, debt (subject to gearing limits), and potential asset sales. Depending on the number of requests received, and the liquidity available to the Fund from those sources, withdrawals may be paid in instalments over time, rather than as a single lump sum.
Full details will be provided in the information pack. If you have any questions about the Liquidity Event or would like to discuss your options, our Investor Services Team is here to assist.
Portfolio performance
The Fund’s portfolio continues to perform strongly, with occupancy at 96.5% and a weighted average lease expiry (WALE) of 3.6 years.
Our expert in-house Facilities Management team demonstrated exceptional responsiveness in early March as Cyclone Alfred approached South-East Queensland. Although downgraded to an ex-tropical cyclone by landfall, the storm caused damage to glazing at the 545 Queen Street building in Brisbane due to airborne debris. Emergency safety works were completed within days, with repairs managed efficiently in collaboration with specialist consultants and insurers.
Tenant engagement and Environmental, Social, and Governance (ESG) initiatives
Cromwell Funds Management continues to prioritise tenant engagement and ESG performance across the Fund’s assets. A variety of tenant-focused initiatives were delivered this quarter, including Welcome Back to Work, Valentine’s Day activations, International Women’s Day, the Share the Dignity drive, and Earth Hour. These events enhance tenant satisfaction and support strong lease renewals in a competitive market.
There were also several ESG milestones achieved:
Flinders Street, Townsville received its first 6-star NABERS Energy rating, a 5.5-star Water rating, and increased its Renewable Energy Indicator to 99.3%, thanks to its use of 100% green power since January last year.
Solar installations across multiple assets have led to reductions in base building electricity consumption by up to 27% over the past 6–9 months.
Results from the latest tenant survey showed that 61% of respondents consider ESG factors important or very important in their leasing decisions.
Recent building enhancement
A major upgrade to the heating system at 100 Creek Street, Brisbane, was completed during the quarter. This project included the installation of electric duct heaters, mechanical switchboards, and an upgrade to the Building Management System (BMS), ensuring a comfortable environment for tenants during the winter months. The works were delivered with minimal disruption and came in just under budget—a testament to the expertise of our Projects Team.
Footnotes
Data sourced from various ABS publications, except where otherwise specified
CBA, 9 April 2025
NAB, 2 April 2025
Large occupiers are those greater than 1,000 sqm
IDPS Operators are not required to complete the Withdrawal Request Forms. Operators can lodge withdrawal requests for their underlying clients by sending the registry electronic messages to redeem via Calastone.
About Cromwell Direct Property Fund
Read more about Cromwell Direct Property Fund, including where to locate the product disclosure statement (PDS) and target market determination (TMD). Investors should consider the PDS and TMD in deciding whether to acquire, or to continue to hold units in the Fund.
The S&P/ASX 300 A-REIT Accumulation Index gave back some of the gains seen in the previous quarter, dropping 6.1%. Property stocks underperformed …
Why listed property deserves a place in investors’ portfolio – A conversation with Stuart Cartledge
Listed property has long been a staple for investors seeking sustainable income and exposure to commercial real estate. Yet, in recent times, some asset consultants and researchers have shifted allocations toward global real estate investment trusts (GREITs), citing concerns about concentration risk in the Australian market. To explore why listed property still deserves a place in a well-diversified portfolio, we sat down with Stuart Cartledge, Managing Director of Phoenix Portfolios, to discuss the opportunities in listed property, diversification strategies, and how Phoenix approaches the market.
What opportunities does listed property provide for investors?
According to Stuart, one of the key benefits of listed property is the ability to gain exposure to commercial real estate in a diversified and liquid manner.
“The key issue that most of us have with commercial real estate is that we don’t have enough money to achieve diversification, and we may not have a long enough investment horizon to forfeit the need for liquidity,” he explains.
Unlike direct property ownership, where selling can take months or even years, listed property allows investors to buy and sell easily on the stock market, providing much-needed flexibility.
Beyond liquidity, listed property also offers sustainable, forecastable income streams. Most investments in the sector generate returns through ownership and rental income, with long-term leases often secured by blue-chip or government tenants. This makes the income more predictable compared to other asset classes.
A listed property investment typically derives the majority of its return through the ownership and rental of commercial real estate. Investors gain proportional ownership in a portfolio of commercial property assets, along with professional management to collect rent, maintain buildings, and, most importantly, distribute income to unitholders. Commercial real estate is typically leased on long-term contracts, often to blue-chip or government tenants, making the income stream reasonably forecastable and reliable.
Diversification
Liquidity
Regular income stream
Professional management
Long leases to quality tenants
Small investment through proportional ownership
How do you manage concentration risk and uncover opportunities?
Stuart acknowledges the concentration risk in the local listed property market, particularly in index-heavy names like Goodman Group, which dominates traditional benchmarks. However, Phoenix Portfolios takes a benchmark-unaware approach, expanding its investment universe to include a much broader set of opportunities.
“To assist us in creating the best risk/return trade-off, we have expanded the universe of potential holdings to be around three times the size of the benchmark portfolio,” Stuart explains.
This allows Phoenix Portfolios to uncover hidden opportunities, particularly in smaller property stocks that are often overlooked by large institutional investors. The research process involves fundamental analysis, meeting management teams, and conducting site visits to assess long-term value.
Another key differentiator for Phoenix Portfolios is its focus on after-tax returns, which is particularly relevant for Australian investors.
“We fully value the franking component of any dividend or distribution because we know our investors will,” Stuart notes. This approach enhances after-tax outcomes, making listed property even more attractive for Australian investors.
Webinar: Why your client's portfolio needs a slice of property
Would you like to explore how listed property could fit into your clients’ portfolios? Watch our webinar recording, where Stuart Cartledge, Managing Director of Phoenix Portfolios and the portfolio manager of the Cromwell Phoenix Property Securities Fund, shares key benefits and strategies for investing in the sector.
Speaker
Stuart Cartledge, Managing Director, Phoenix Portfolios
Webinar details
Property can be a powerful addition to a well-balanced portfolio, offering solid asset backing, inflation protection, and diversification benefits that differ from bonds and equities. But how can advisers navigate the complexities of listed property and identify the best opportunities?
Join Stuart as he shares insights on:
The role of property in portfolio construction and risk management
How securitised property works and the diverse opportunities available
The tax considerations that can impact investment outcomes
Why active management is key to accessing the best opportunities in domestic listed property
With decades of experience in listed property investments, Stuart brings deep market insights and a proven track record of identifying attractive yet overlooked opportunities.

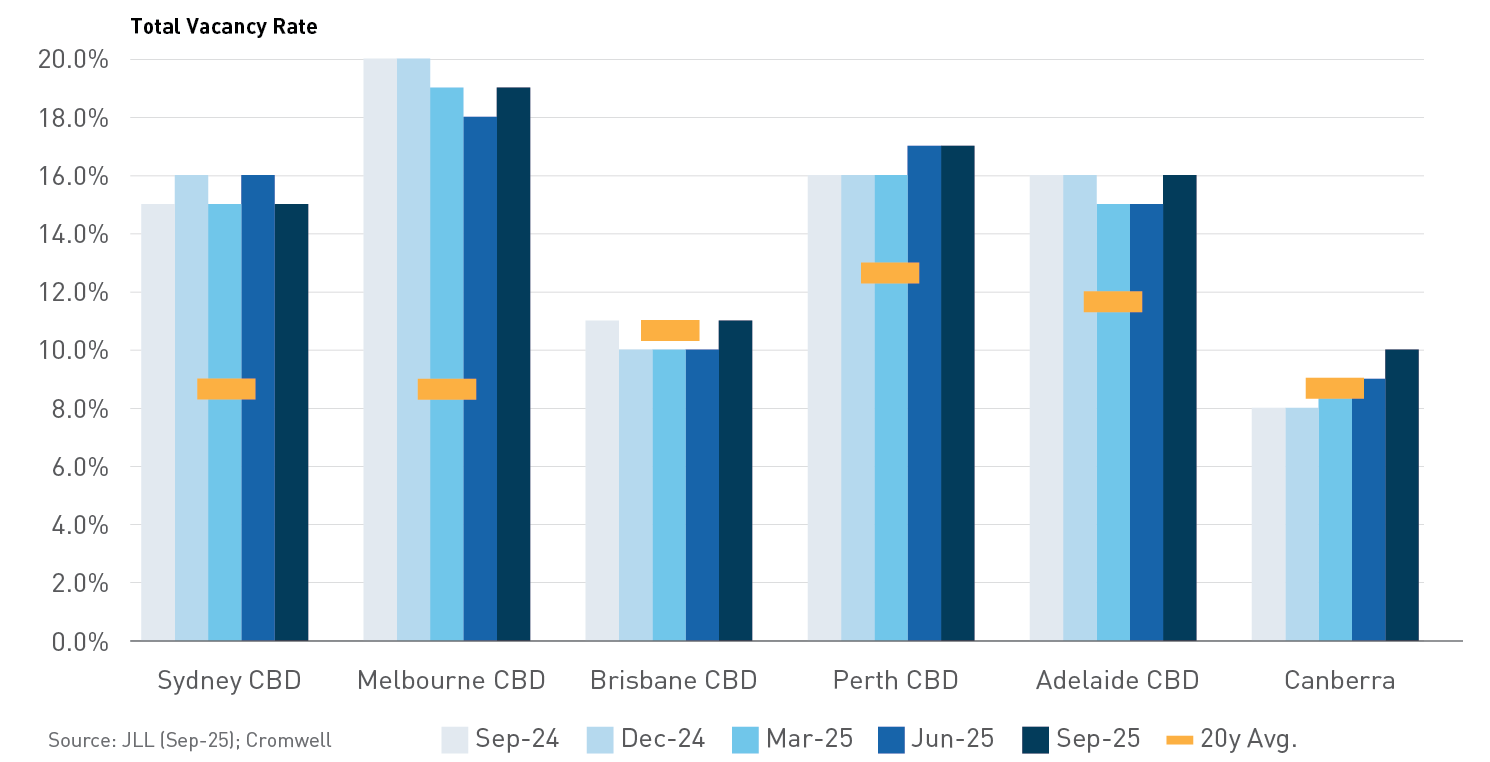
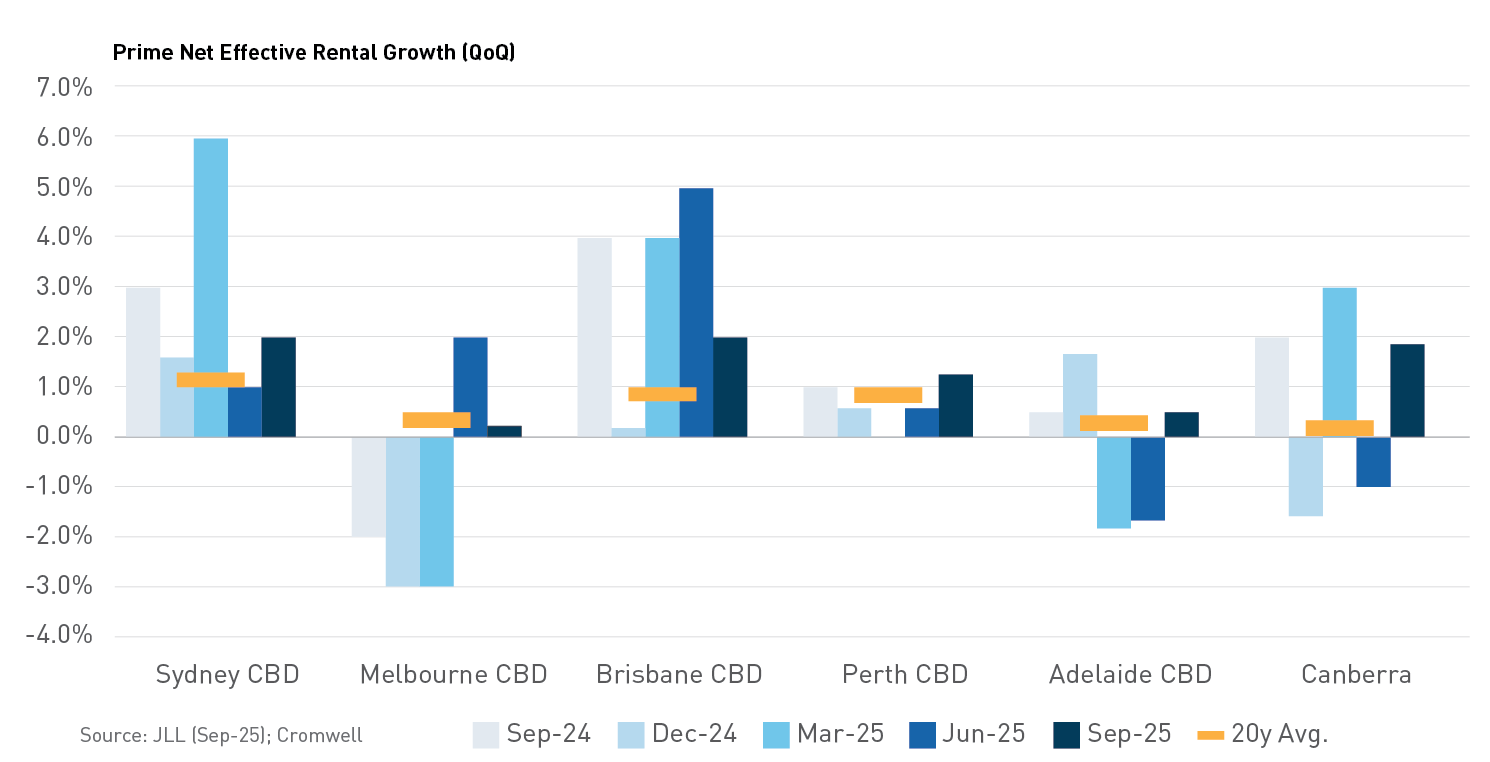


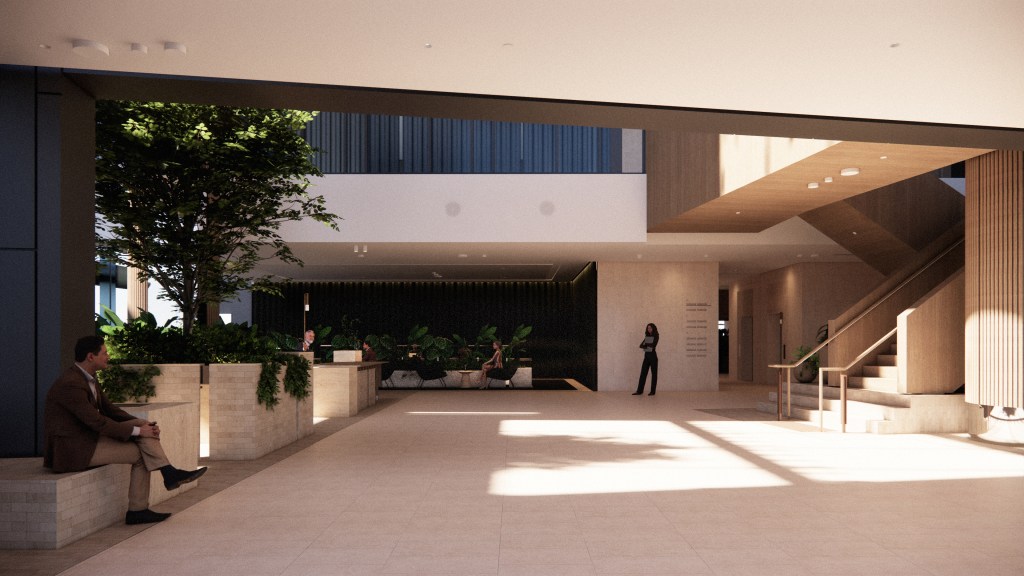
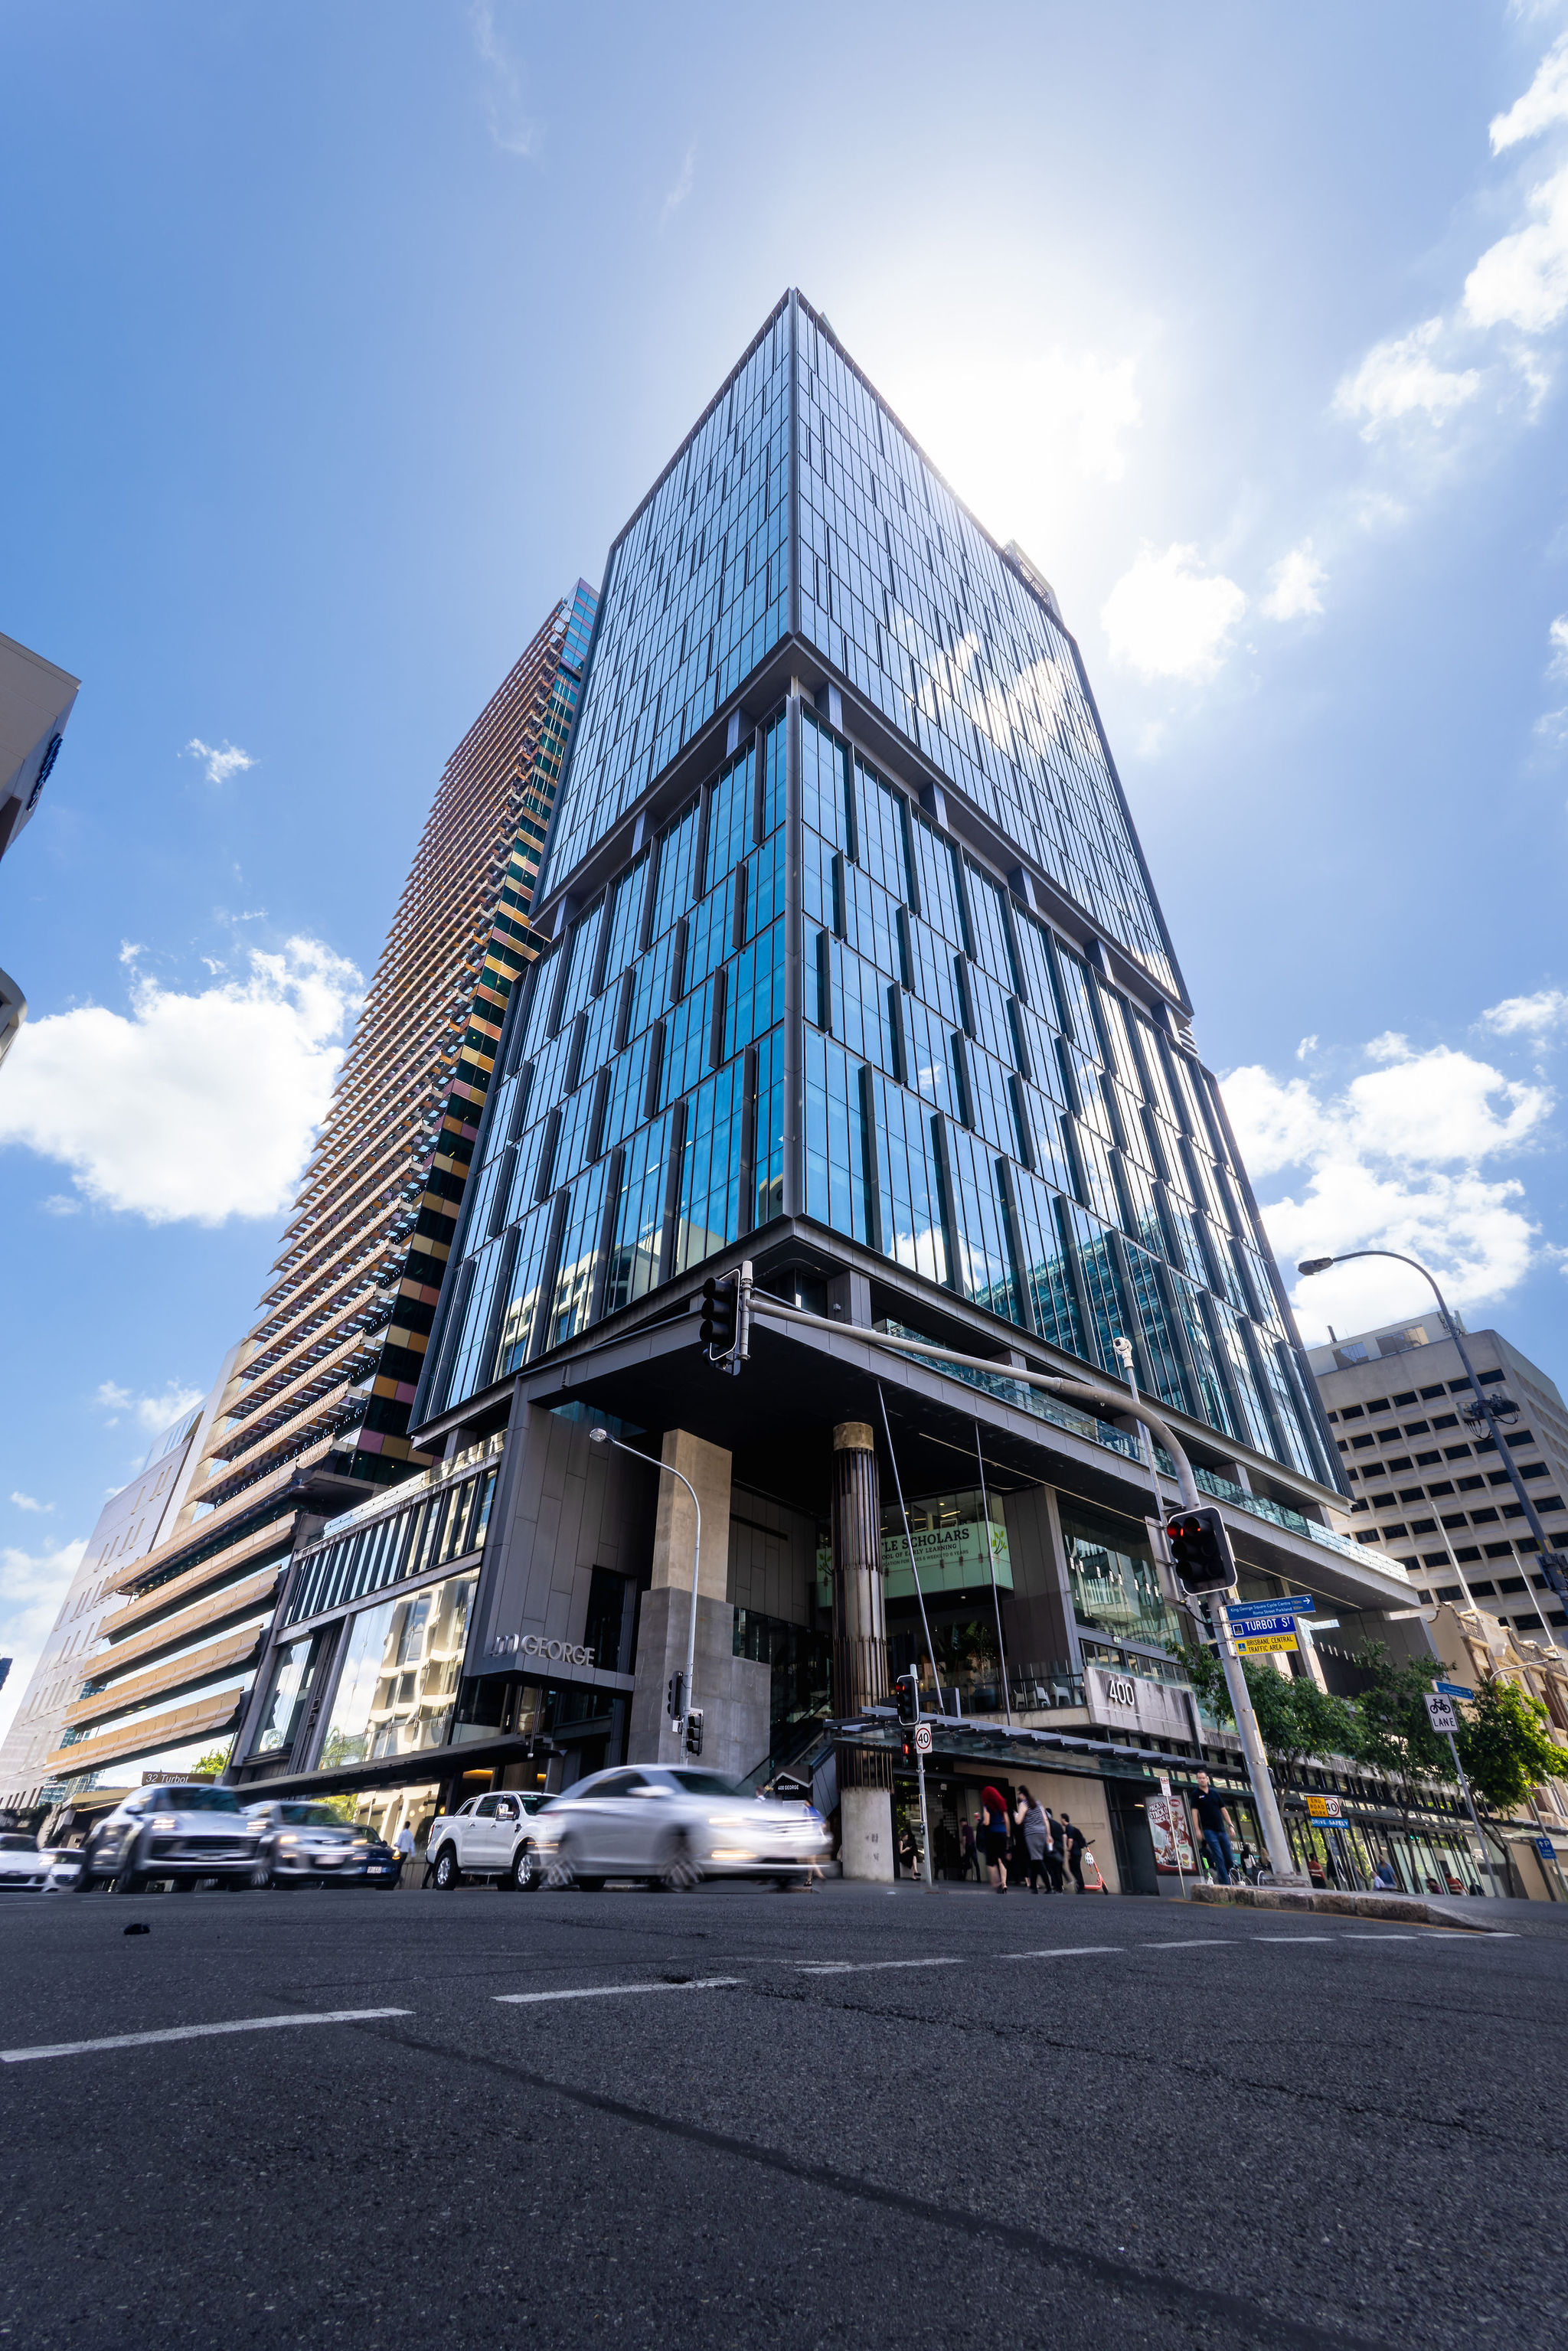
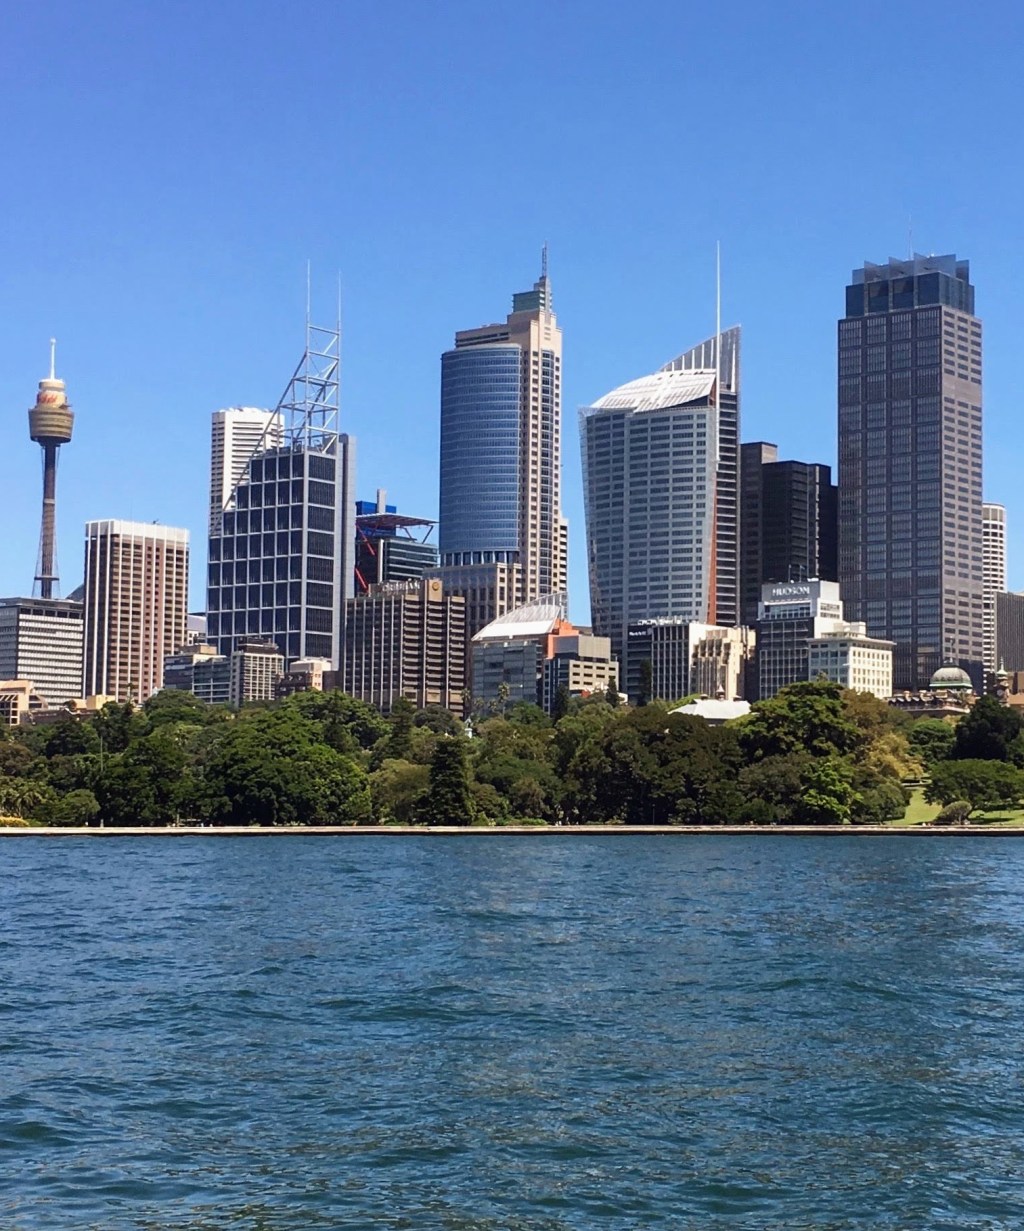


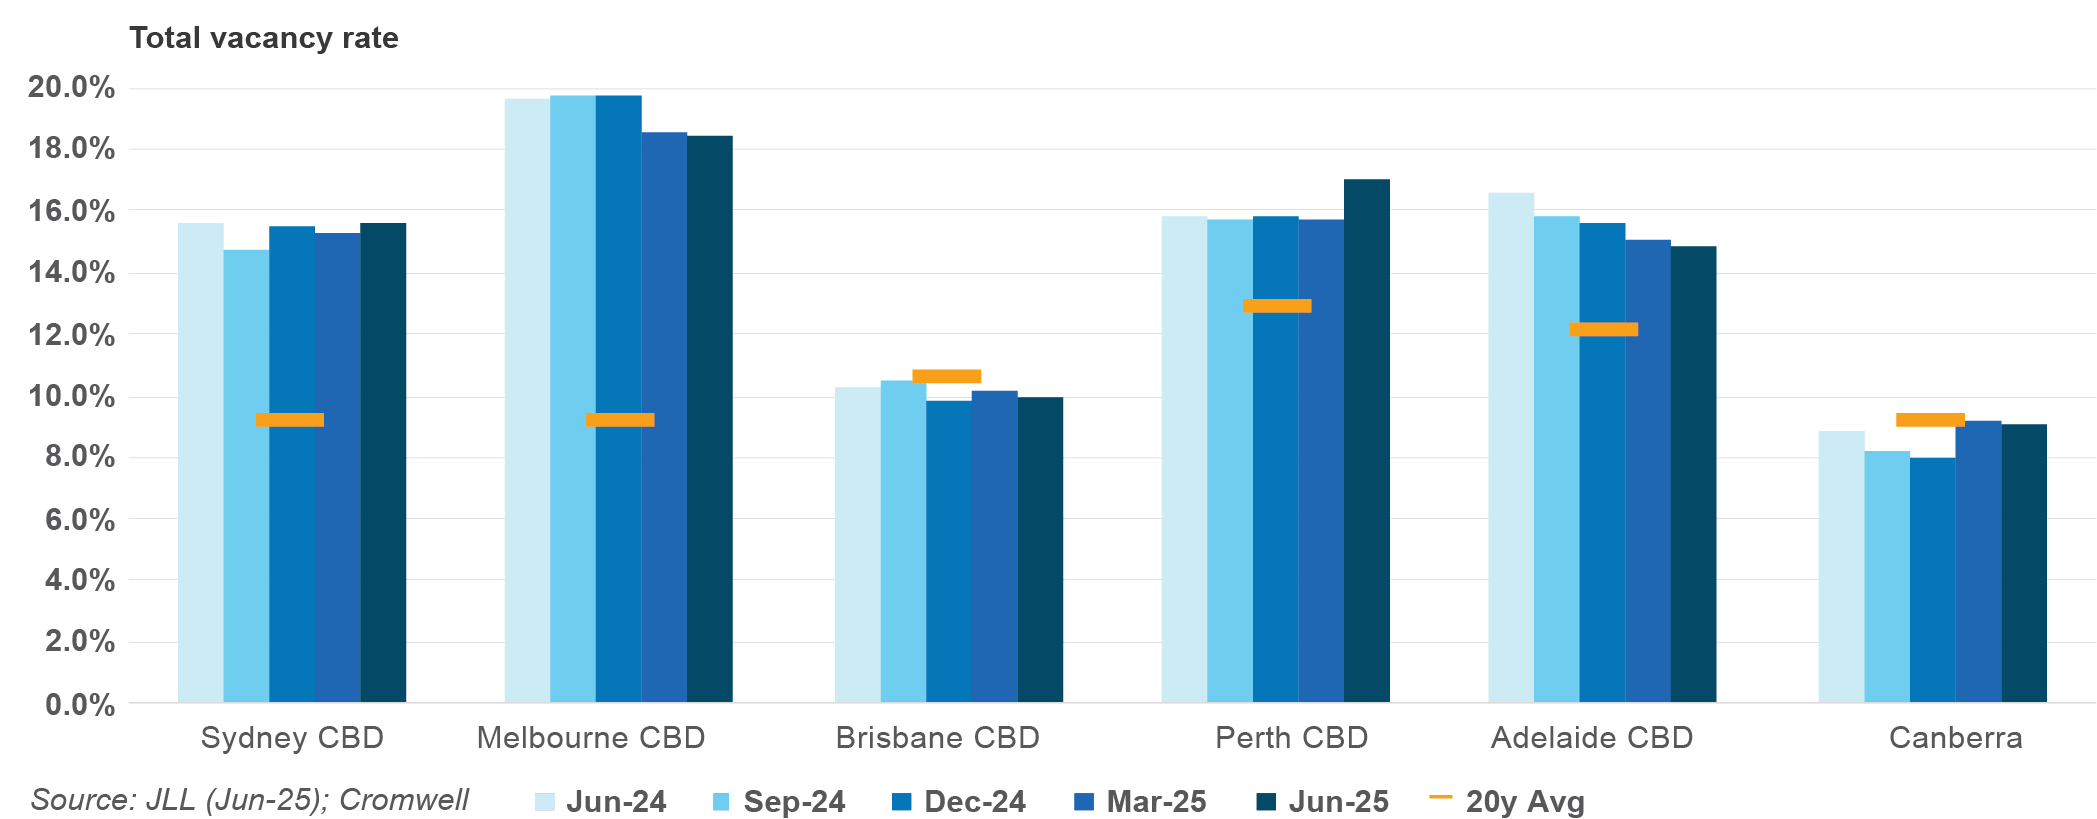

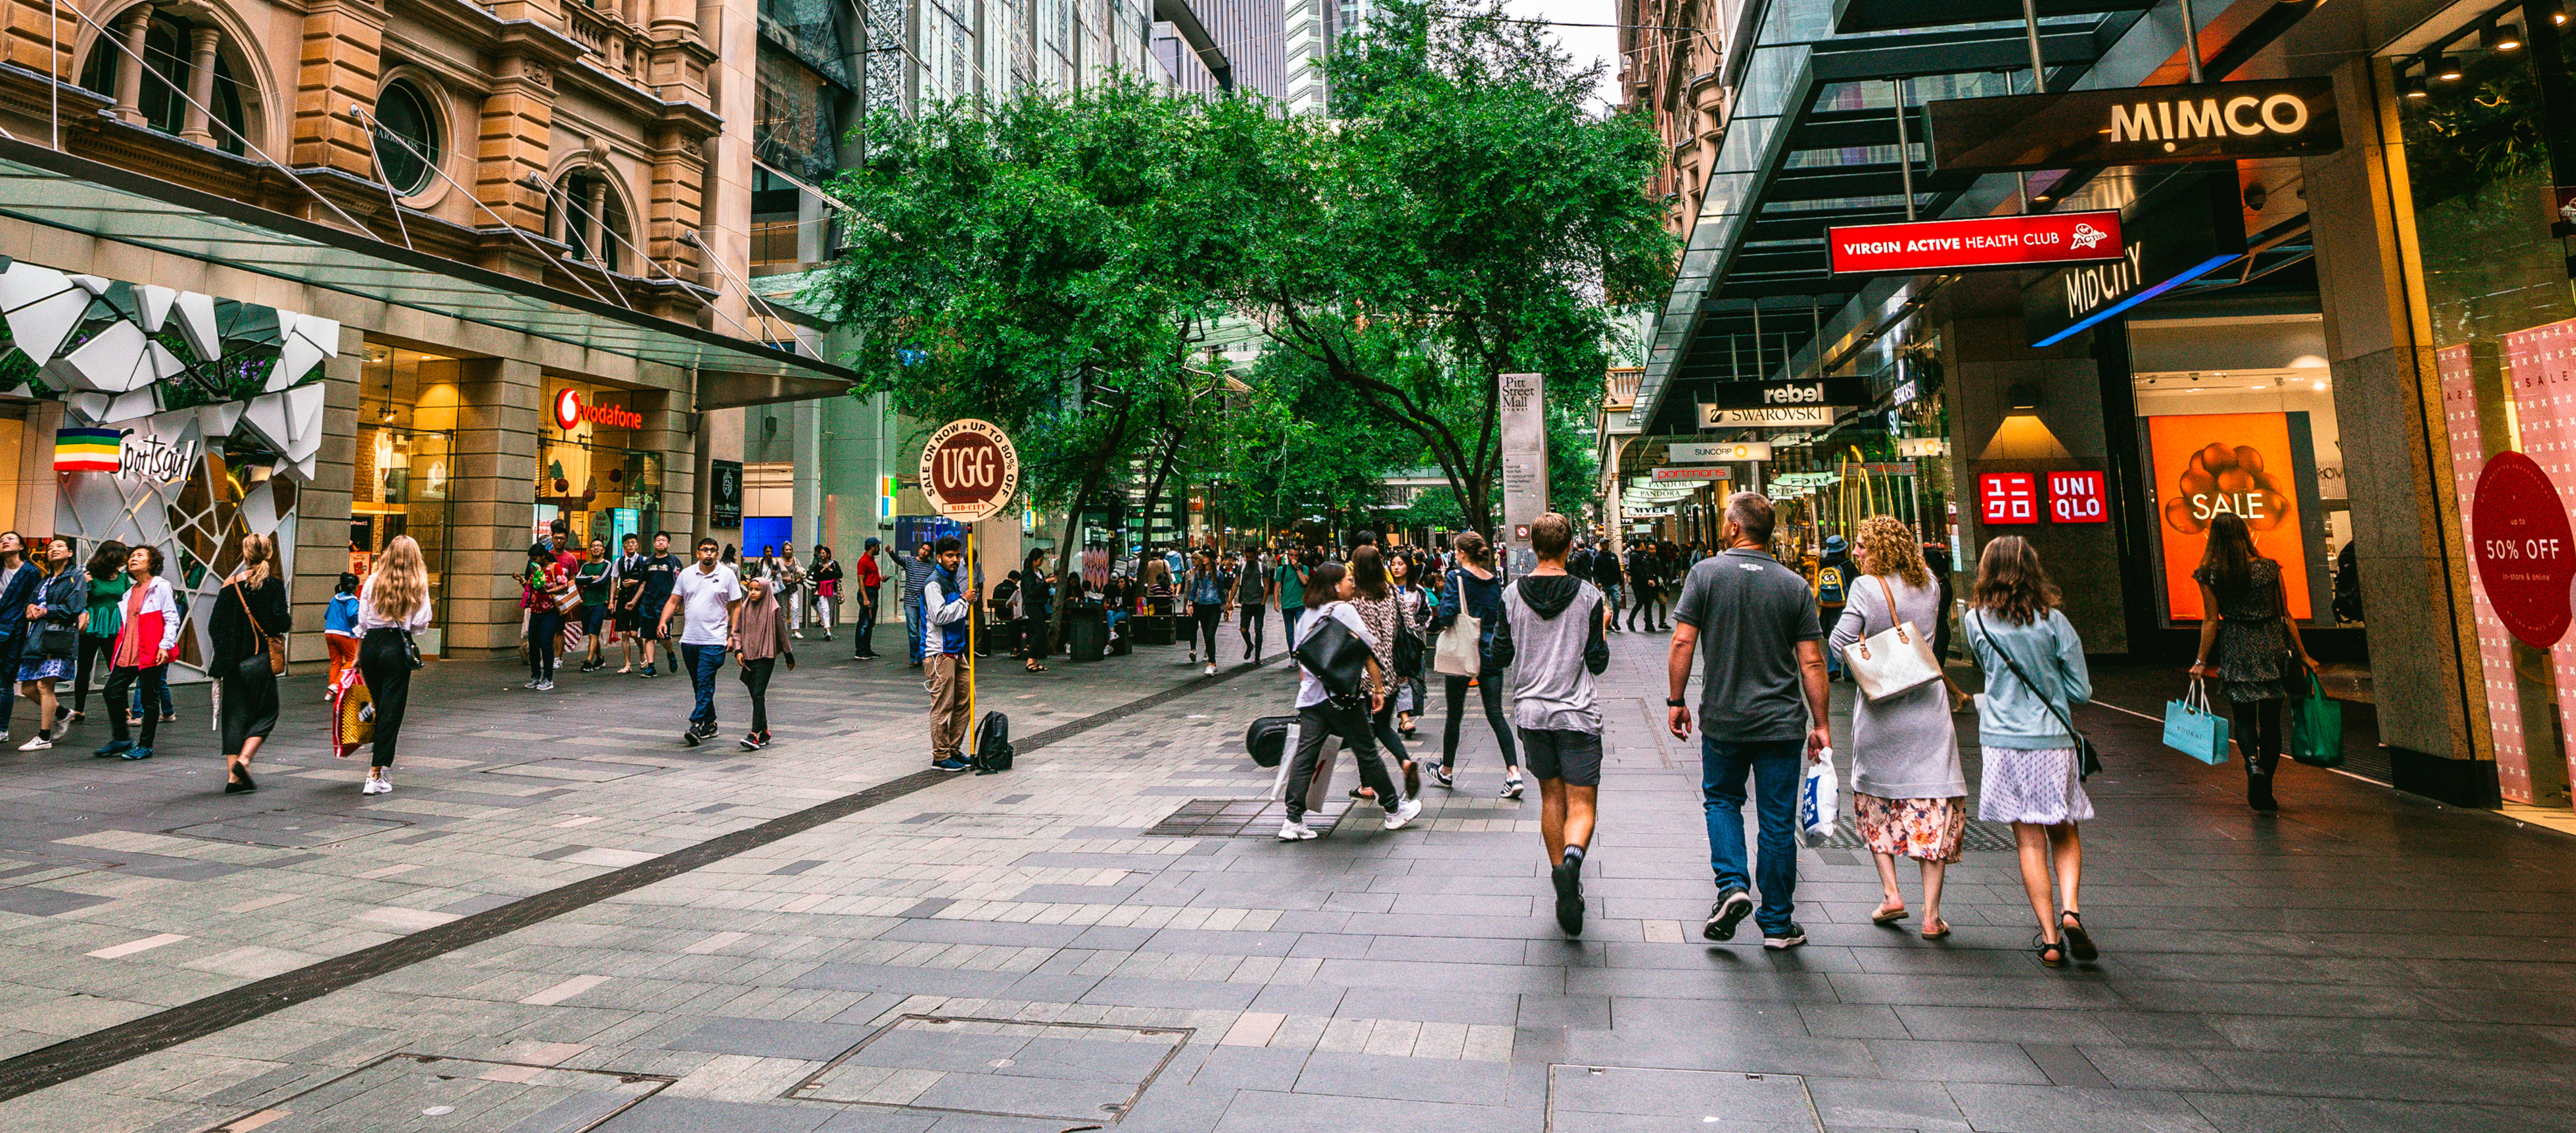
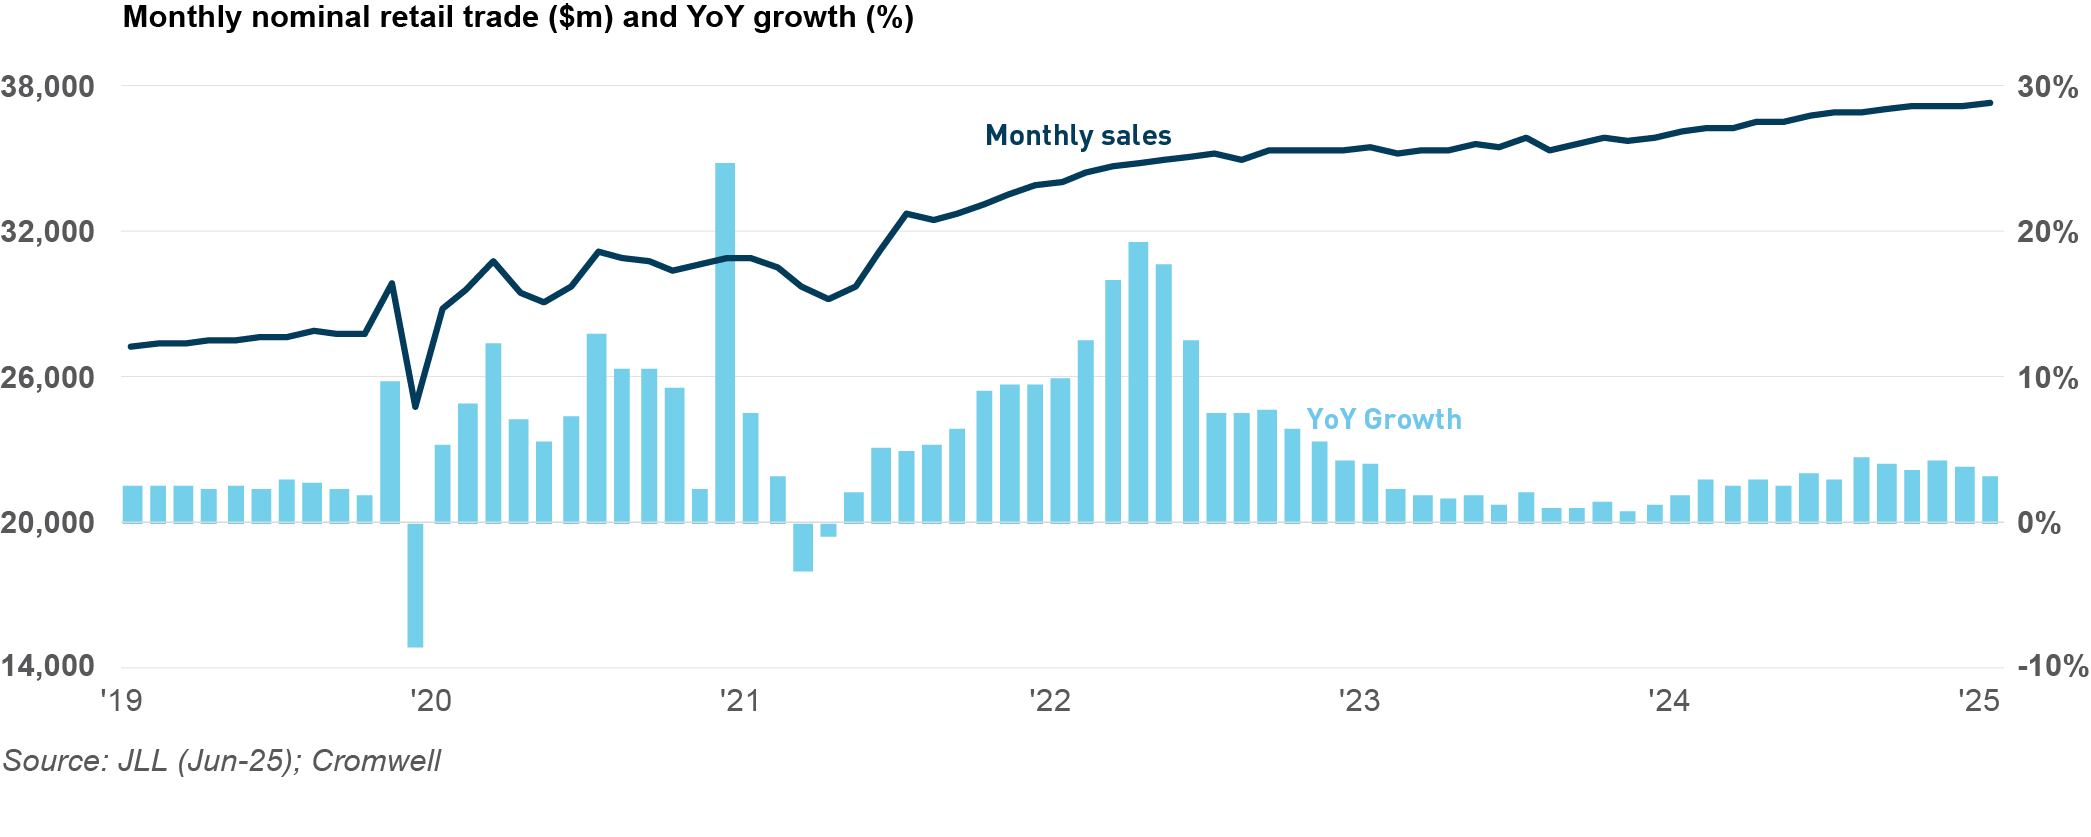
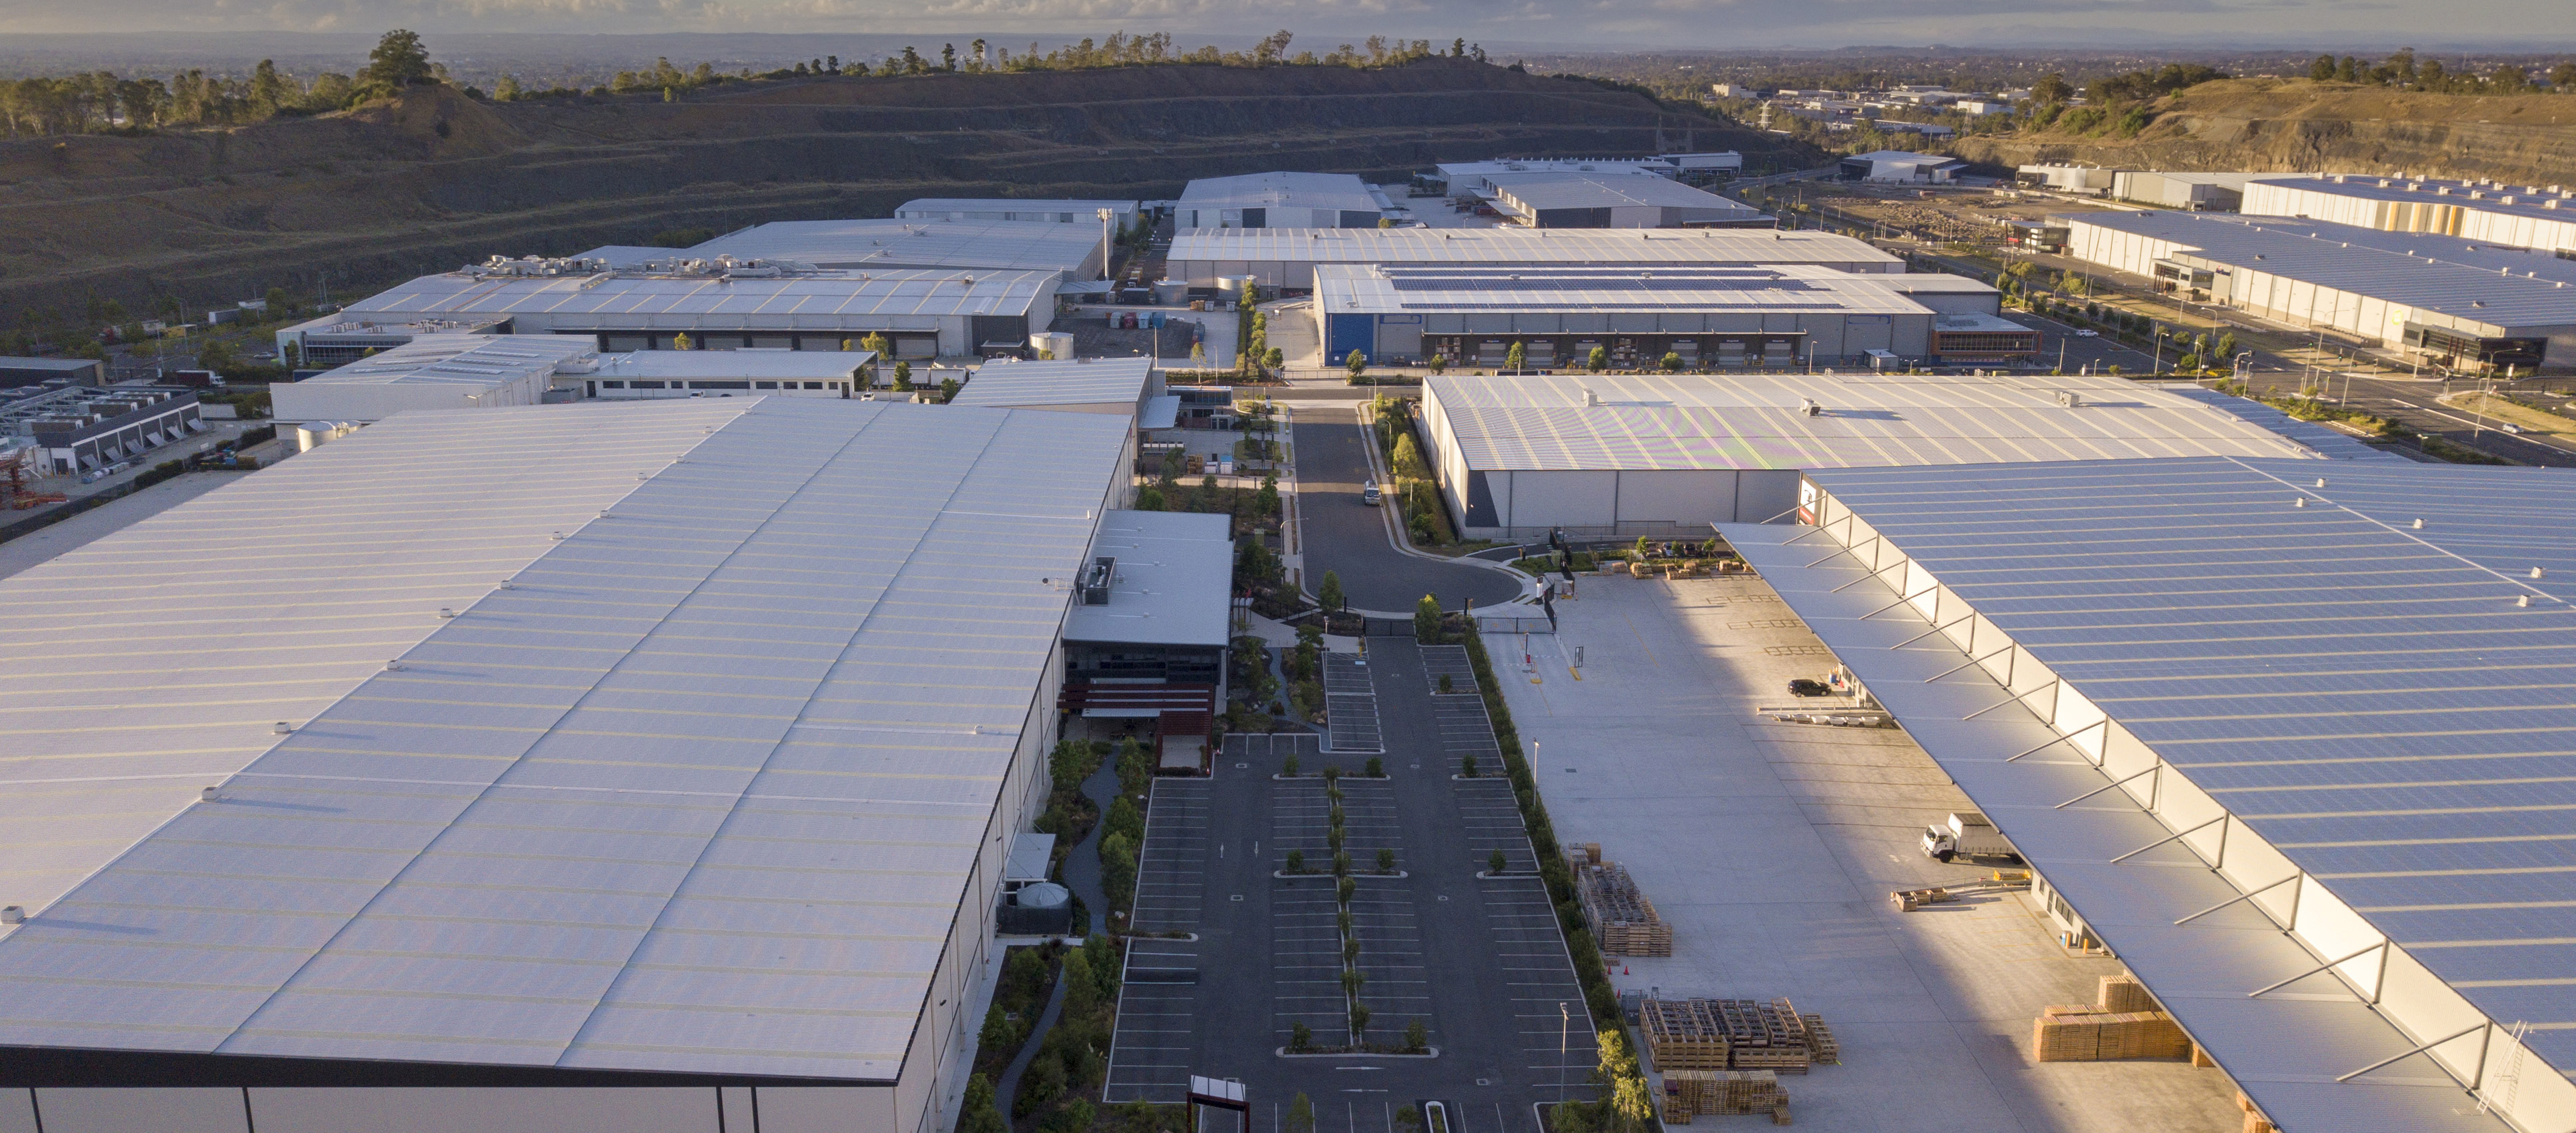
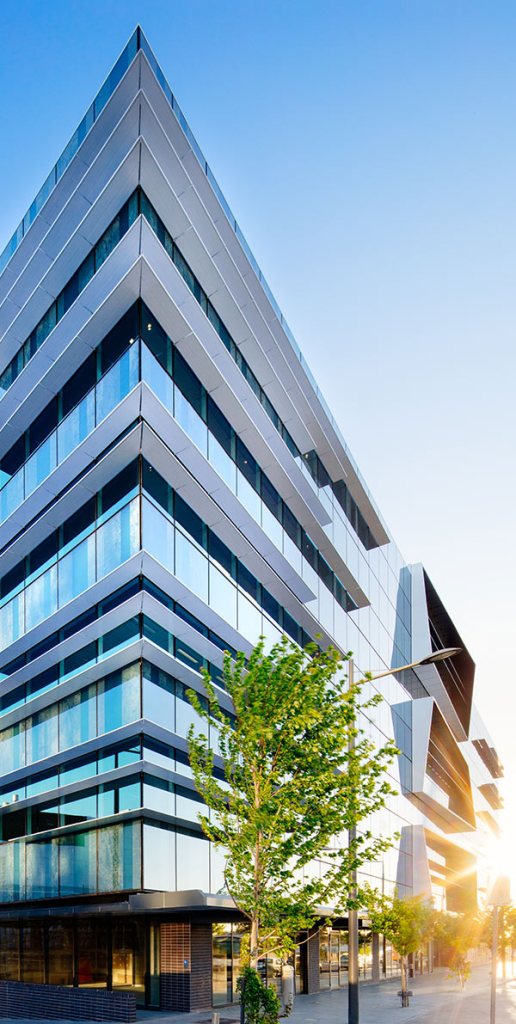 How did the Cromwell Funds Management fare this quarter?
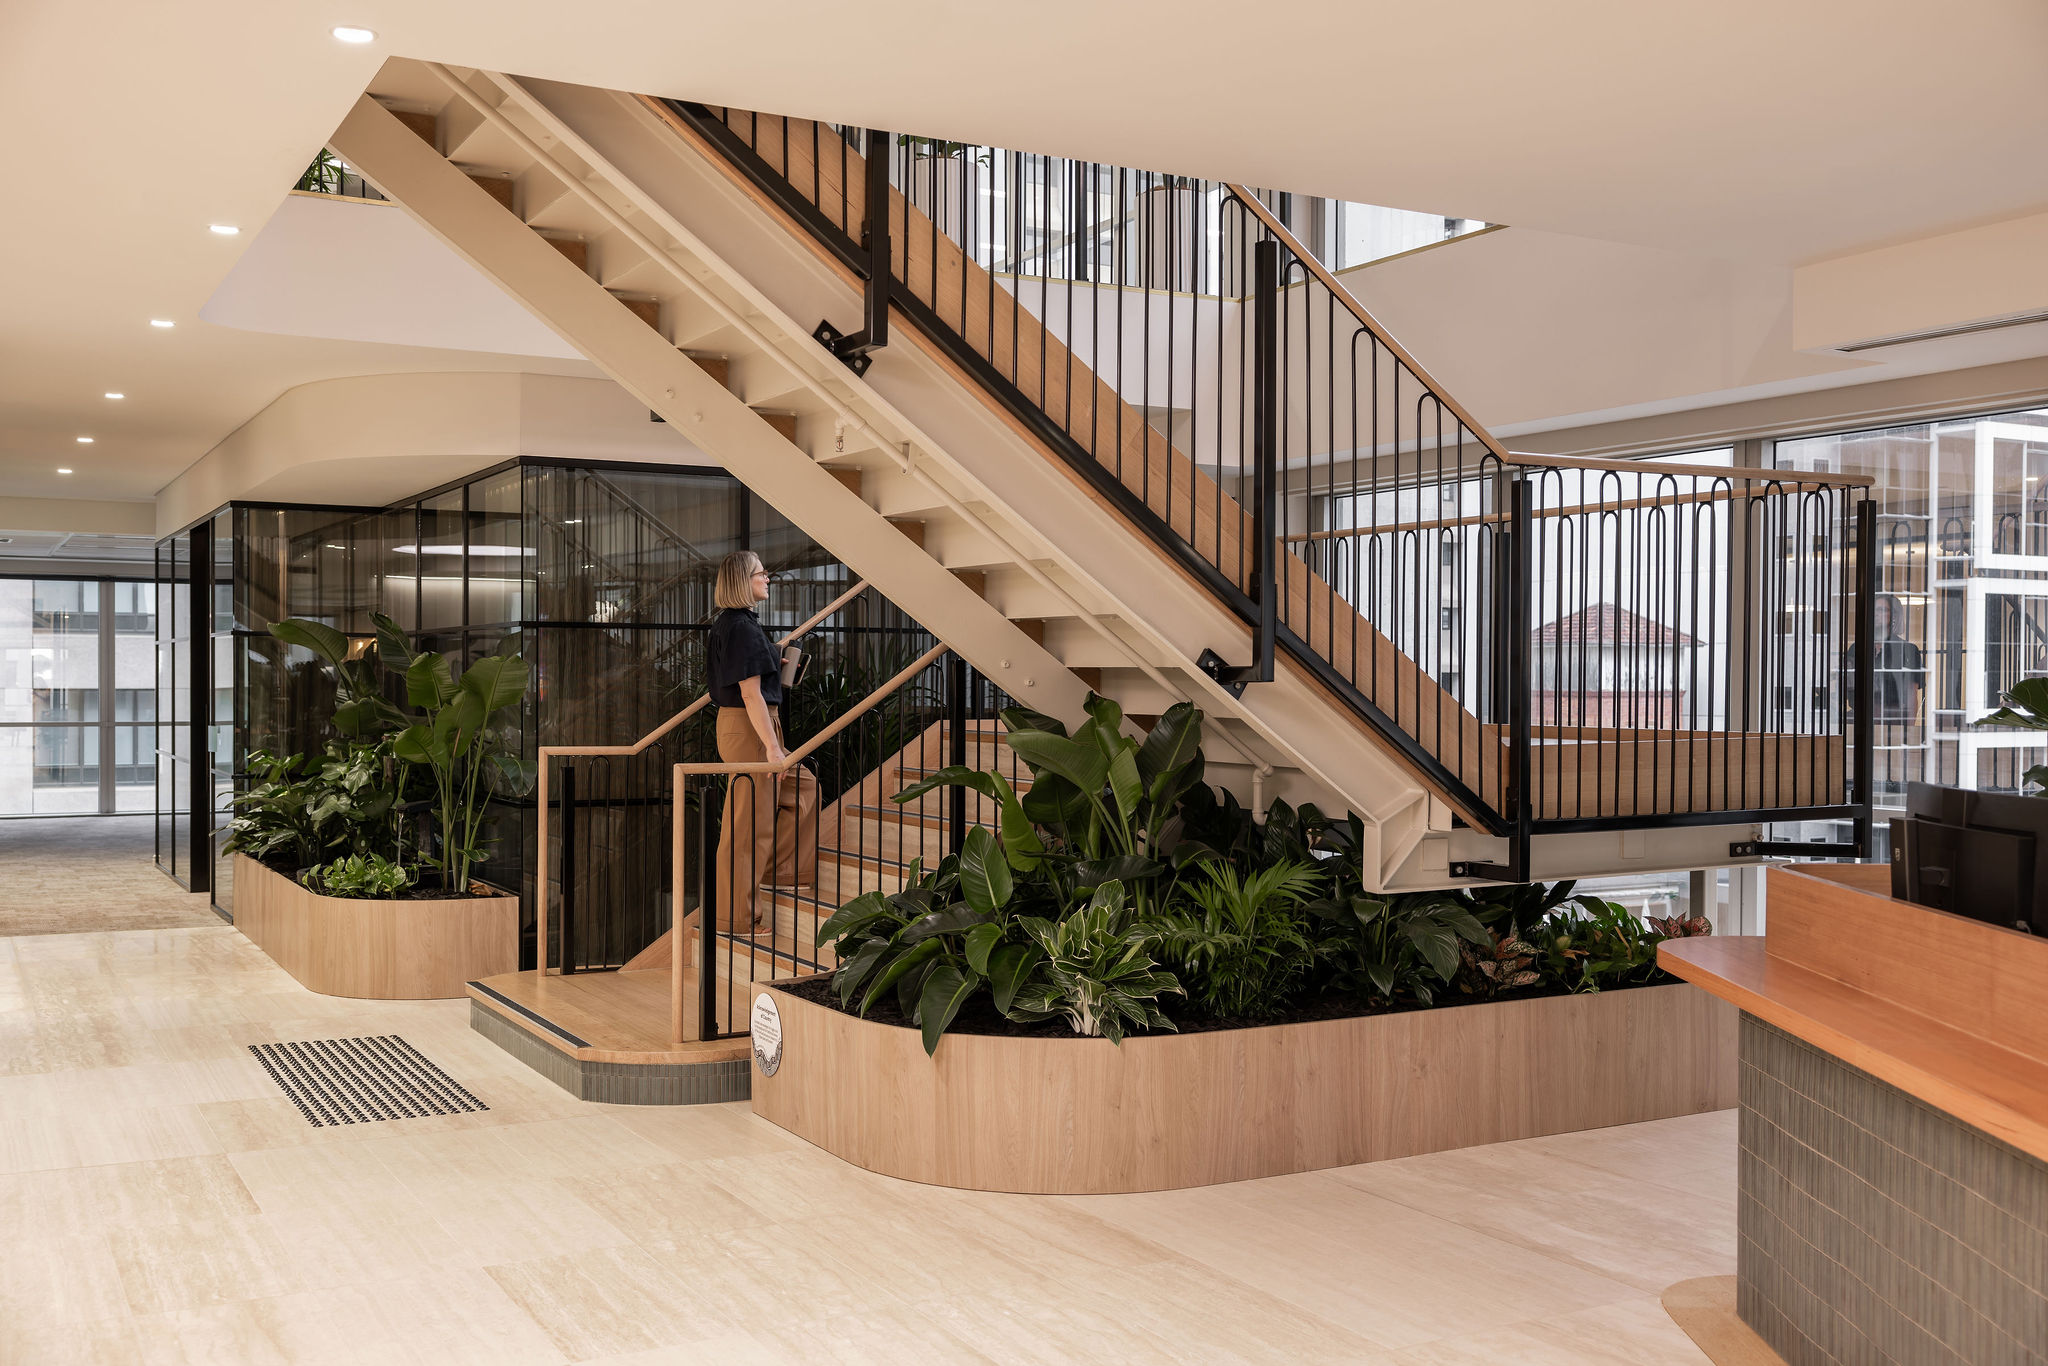
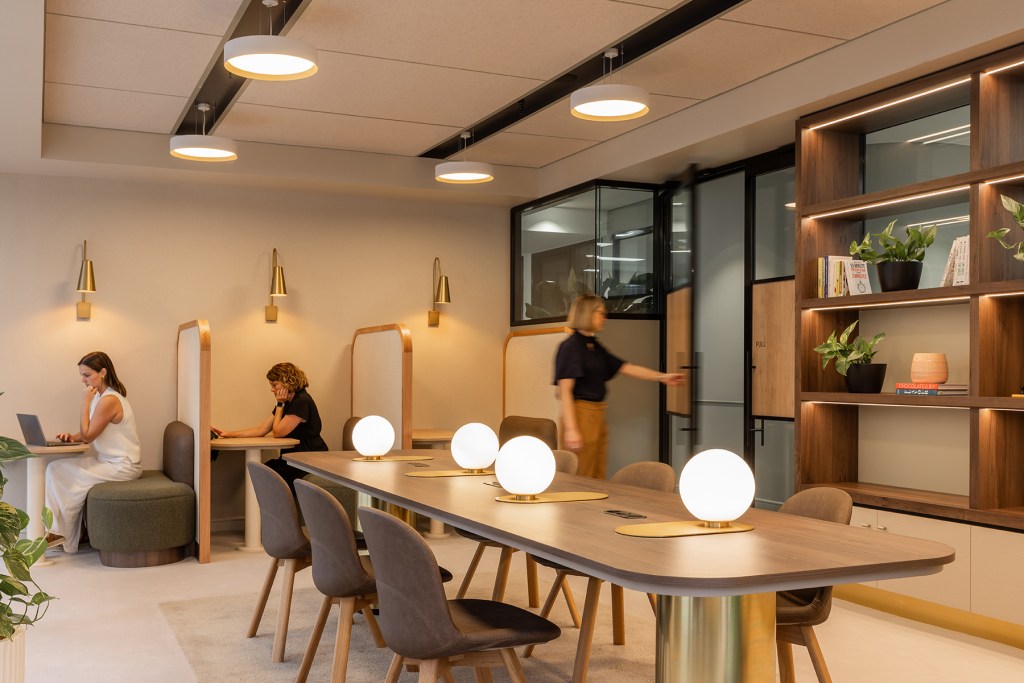 Brendan Sim, Cromwell Development Manager: We are proud of our track record of delivering projects on time, to scope and to budget. Despite having four separate contractors working simultaneously within the building, we delivered the project under budget and handed it over early.
 Maria Correia, Gray Puksand: Cultural shifts in workspace design have evolved significantly over the past few decades, driven by changes in work practices, technology, employee preferences, and broader societal trends. There are several trends emerging some of which we have integrated into the Cromwell workspace however with the rise of the AI workplace, I think moving forward it would be good to focus on the ‘human centric’ workplace trends outlined below.
 HQ North, 540 Wickham Street, Fortitude Valley
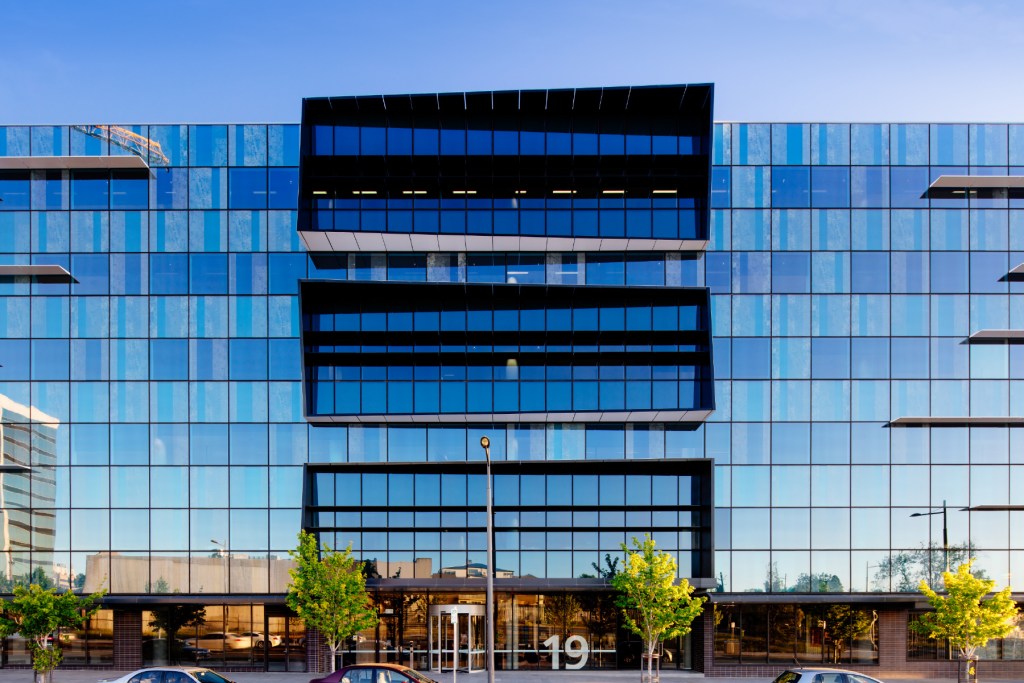 19 George Street, Dandenong
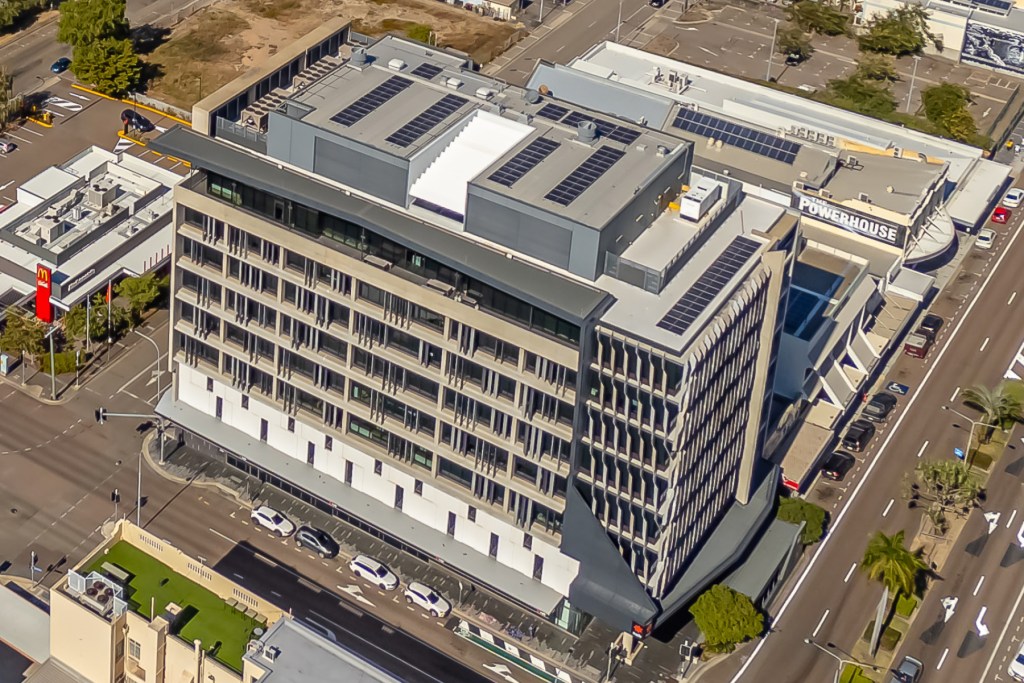 420 Flinders Street, Townsville
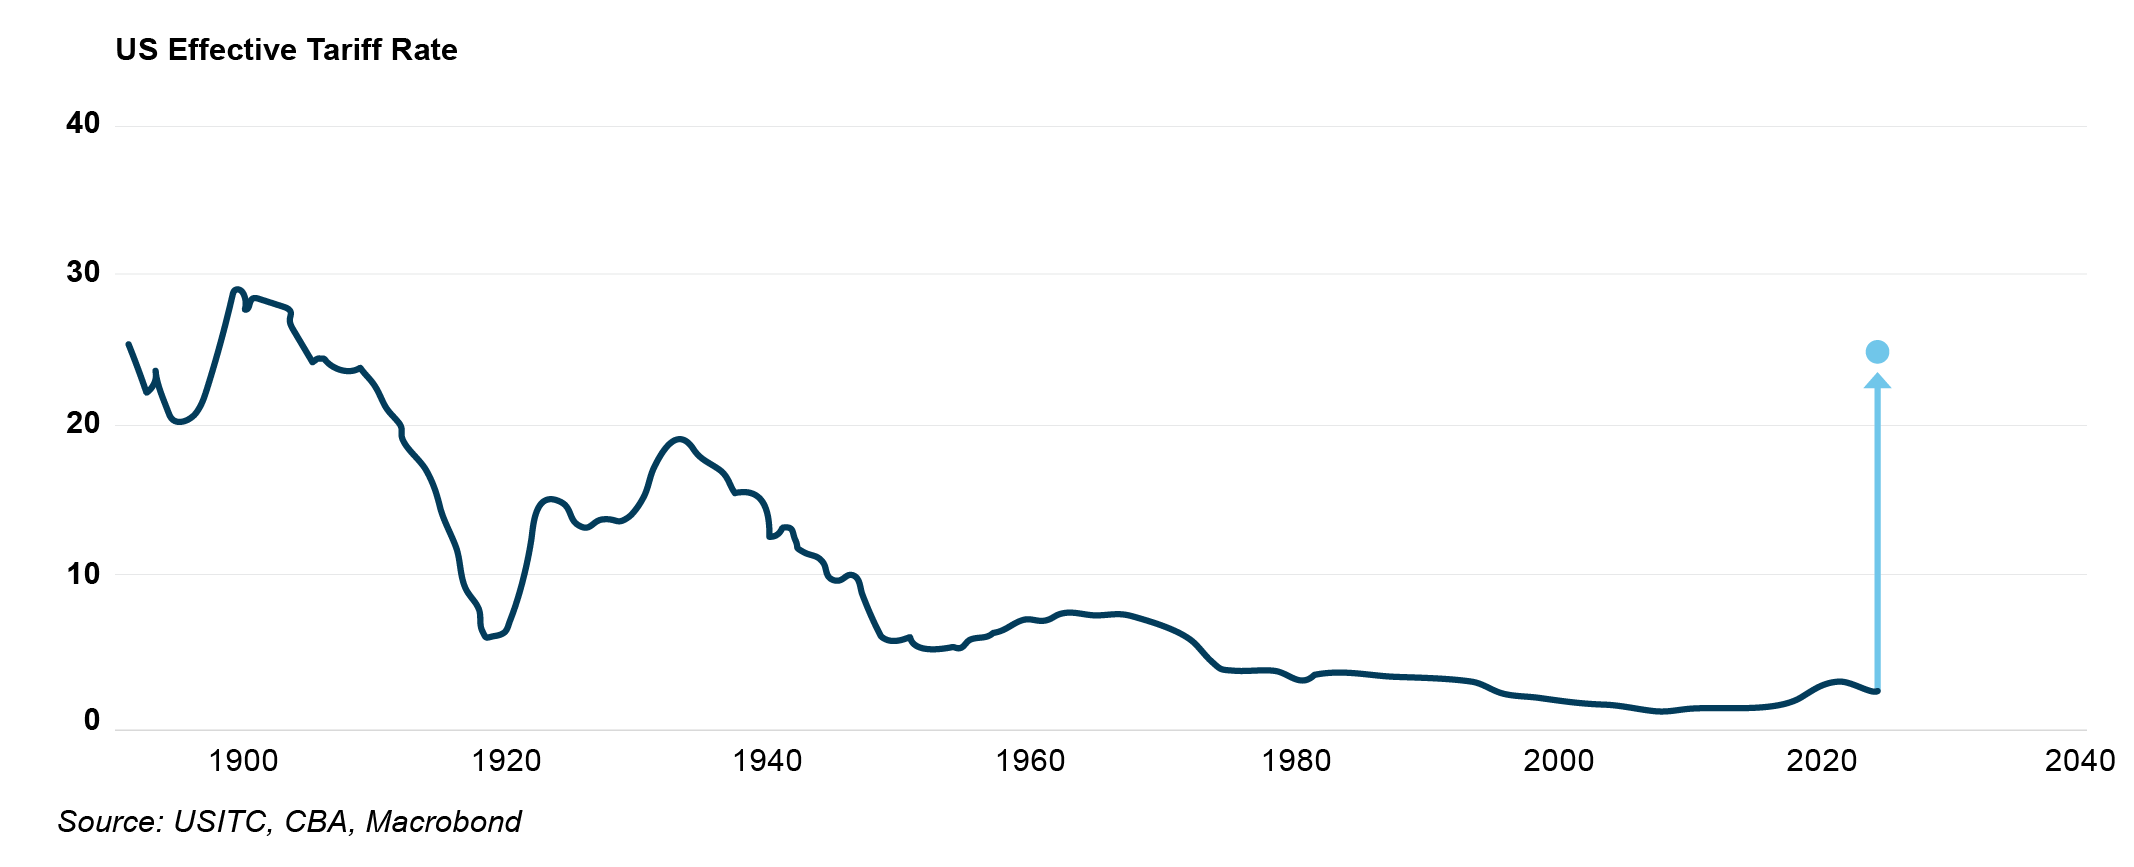
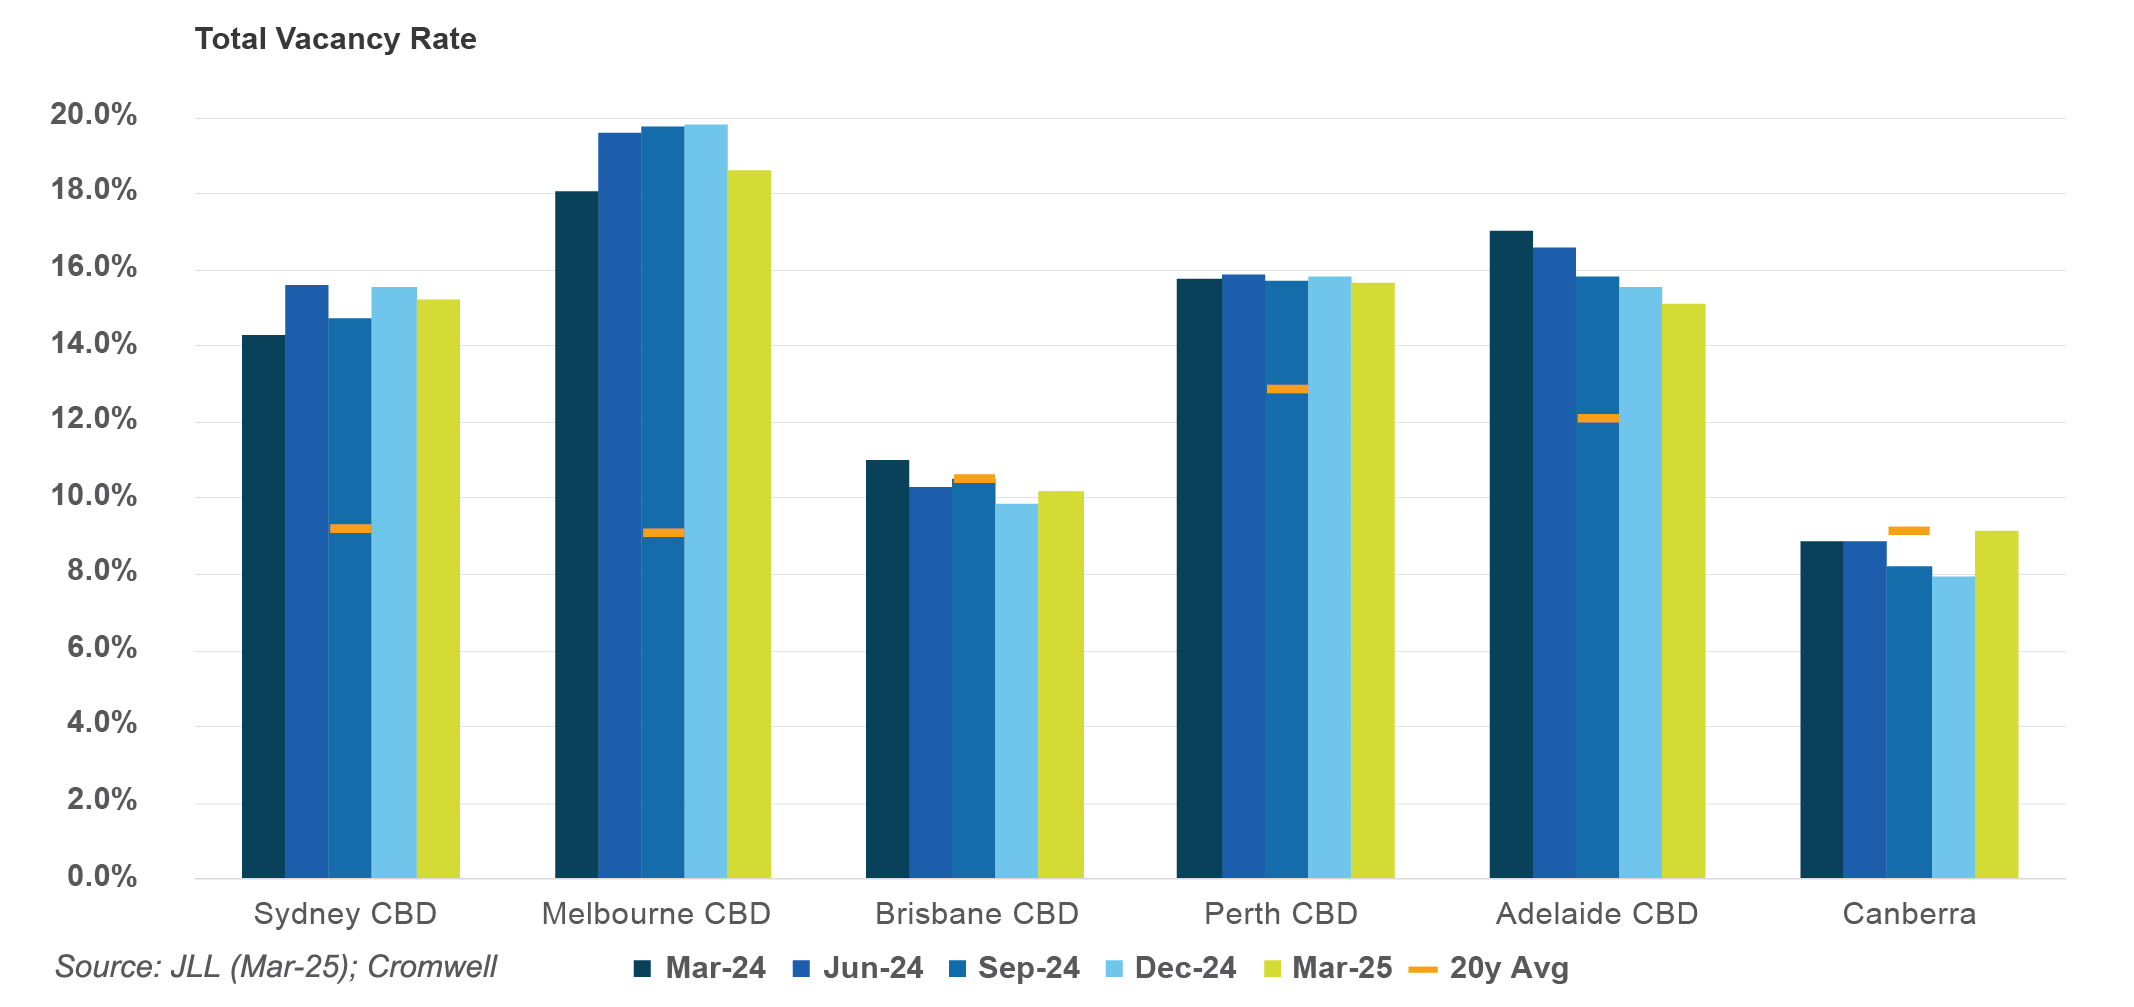
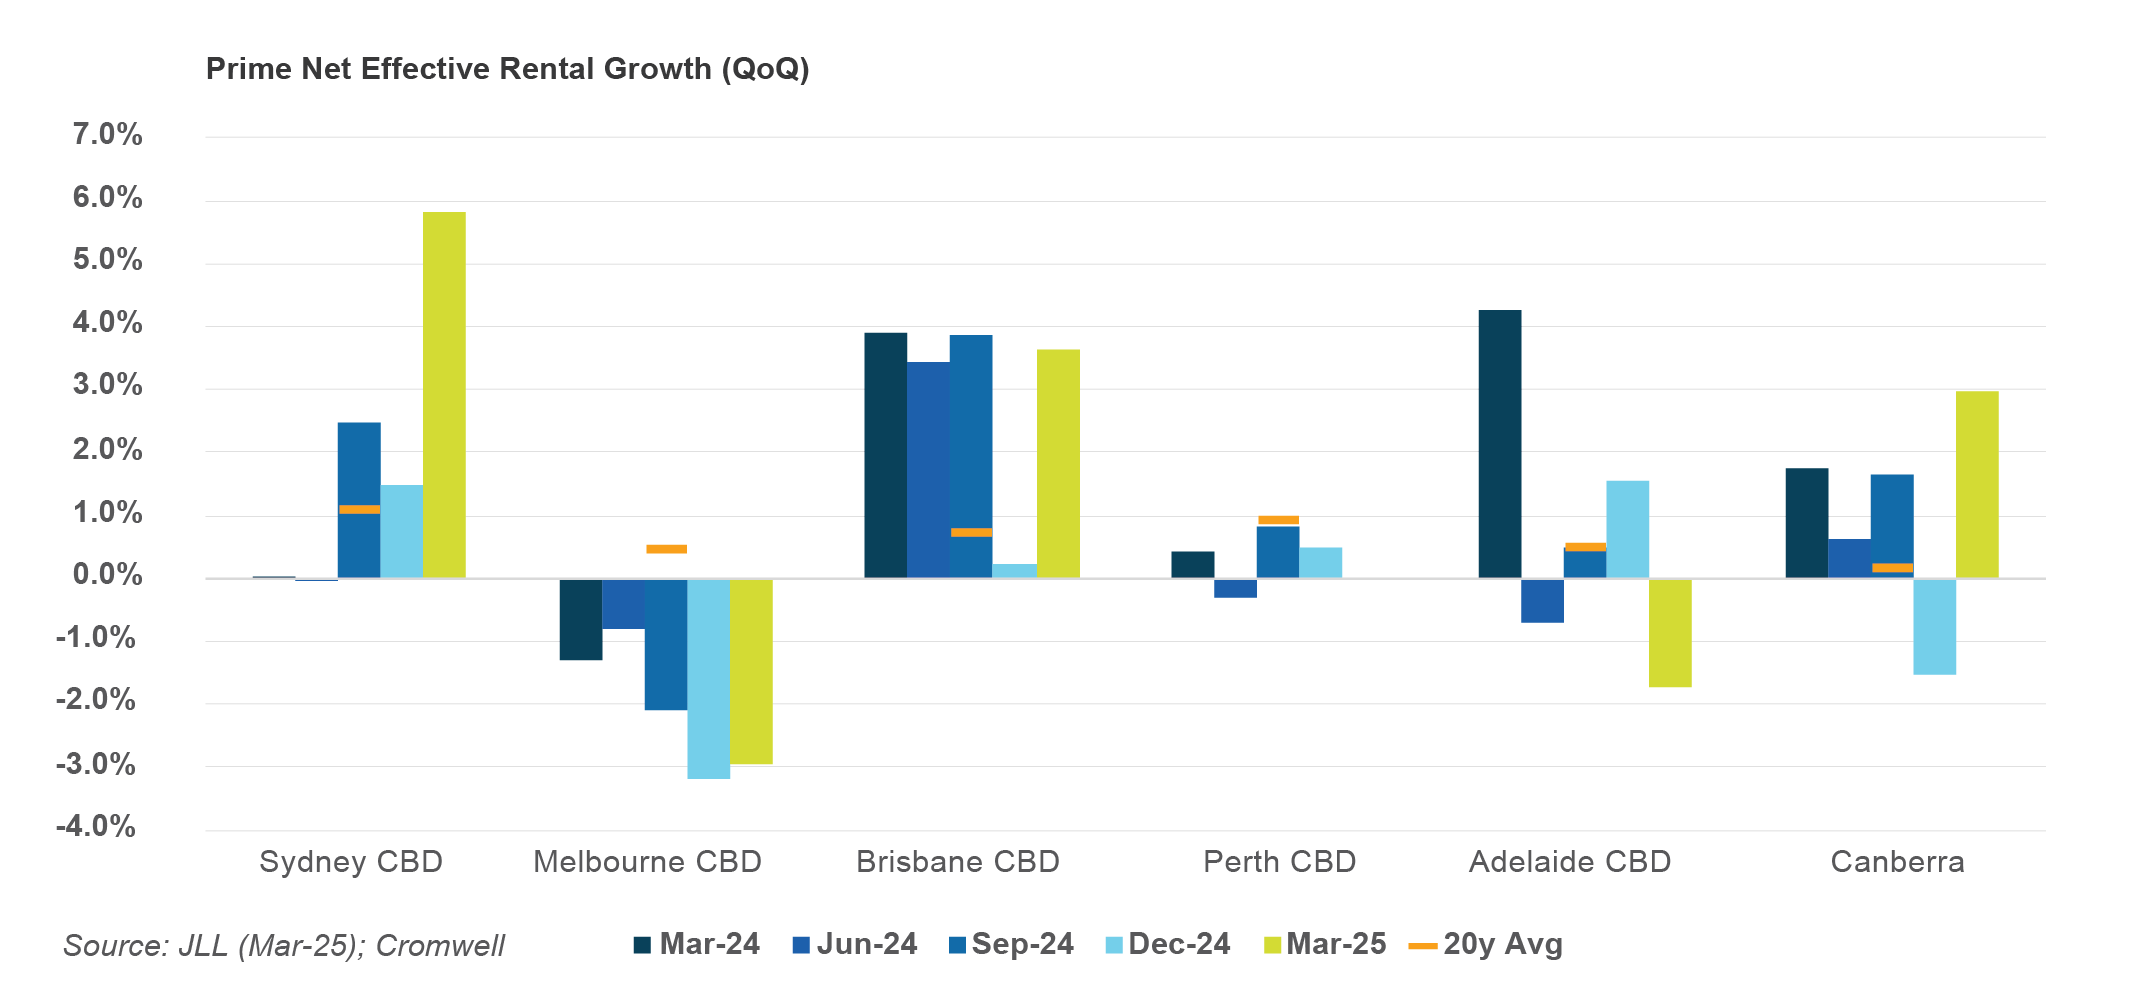

 Listed property has long been a staple for investors seeking sustainable income and exposure to commercial real estate. Yet, in recent times, some asset consultants and researchers have shifted allocations toward global real estate investment trusts (GREITs), citing concerns about concentration risk in the Australian market. To explore why listed property still deserves a place in a well-diversified portfolio, we sat down with Stuart Cartledge, Managing Director of Phoenix Portfolios, to discuss the opportunities in listed property, diversification strategies, and how Phoenix approaches the market.