Base case: augmentation over automation
In our view, the most plausible base case is that AI functions predominantly as an augmentative technology rather than a wholesale substitute for human labour. Central to this conclusion are the incentives and constraints that shape real world economic behaviour.
Firms optimise for growth, not just cost
Businesses optimise not only for cost minimisation but for output quality, growth, resilience, and competitive position. AI can reduce the cost of specific tasks, but its economic value is often highest when combined with human judgement, oversight, and contextual understanding. In practice, this favours a complementary relationship where workers become more productive, decisions improve in quality, and the scope of activity expands.
This will not be a universal experience. Some businesses, particularly those under margin pressure, may use AI primarily to reduce headcount and extract cost rather than to expand. But that response often says as much about the condition of those businesses as it does about the technology itself. Businesses don’t shrink to greatness, and contraction by weaker operators may ultimately create room for stronger firms to invest, grow, and take share.
Automation thresholds will increase
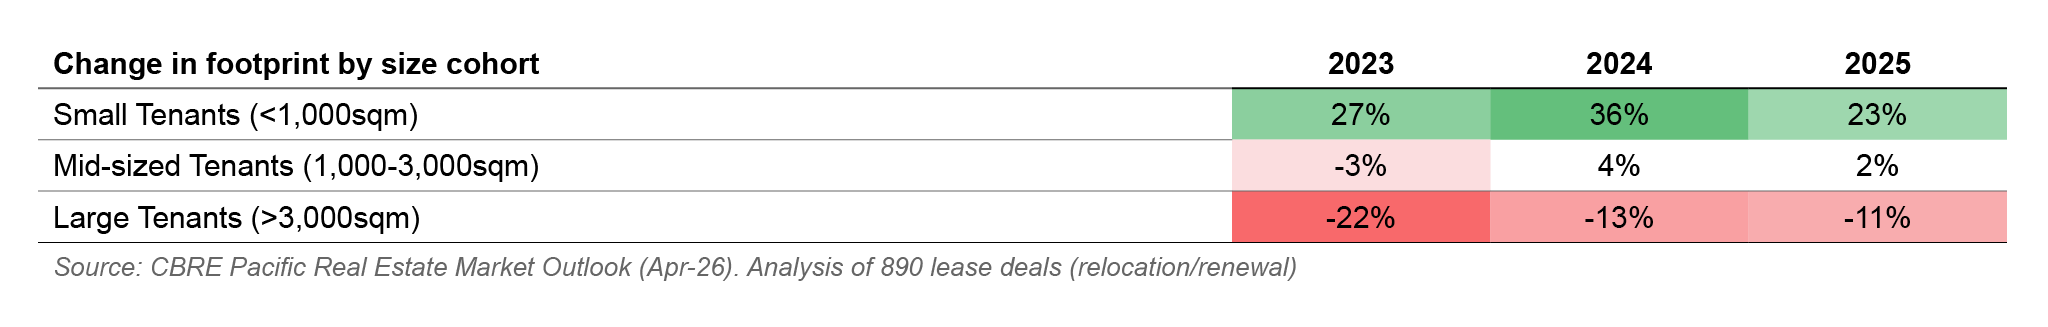
Recent academic research highlights the importance of task quality in shaping how firms deploy automation4. AI is likely to be adopted first in tasks where it can meet existing output quality at low risk. As these lower-value or more routine tasks are automated, human effort is freed up and reallocated toward activities that are more judgement-intensive, relationship-driven or context-specific.
This reallocation improves the quality of the remaining human-led tasks: more time and focus = better output. The quality threshold AI must then reach is increased, making it harder for further automation to occur5. This self-reinforcing augmentation loop sees people focusing more and more on higher value activities, in turn increasing the value of their labour.
Full delegation introduces risks
While AI can enhance productivity across a range of tasks, the case for fully delegating long, complex, or high-stakes work remains less compelling. Microsoft research finds that as task length and complexity increase, AI output quality deteriorates and document contents can become corrupted6. Errors compound across steps, objectives can drift over time, and inconsistencies can be difficult to detect.
Similar issues are evident in software development and cybersecurity. AI-assisted coding tools can accelerate development, but fully delegated code generation has been shown to contain more security vulnerabilities than human-written code7.
These dynamics reinforce the ongoing importance of human oversight and limit the extent to which full automation can be deployed. While the technology will likely improve, it will take time and resources. Productivity gains are therefore likely to be uneven and may be slower to materialise than implied by some of the more optimistic claims.
High unemployment will not be allowed to persist
At a macro level, there are social, economic, and political limits to how long high unemployment can persist without response. South Korea (late 90s) and Spain (early 2010s) are useful modern examples: in both cases, severe labour market deterioration was accompanied by social strain, political pressure and, ultimately, policy adjustment.
Elevated unemployment and the dislocation that accompanies it tend to provoke institutional adaptation aimed at restoring labour market stability. For that reason, the more plausible outcome is slower, more adaptive adjustment rather than a sustained period of mass unemployment.
Downside case: weaker demand but no sectoral collapse
A more pessimistic scenario could arise if the pace of AI-driven disruption materially outstrips the economy’s capacity to adapt. Even in that case, however, the implications for office demand are unlikely to be linear.
A reduction in labour input doesn’t necessarily require a one-for-one fall in employment. Given society’s limited tolerance for sustained unemployment, weaker labour demand would more likely be absorbed through changes in working patterns than through mass job losses. One potential mechanism is a reduction in average working hours, such as the adoption of a four-day work week. This would adjust overall labour supply while avoiding a commensurate decline in employment.
For office markets, fewer hours worked wouldn’t necessarily translate into a proportional reduction in space demand. Offices, like stadiums, are typically configured to accommodate peak occupancy (e.g. anchor days) rather than average utilisation. And in a future where the human-centric elements of work such as collaboration, innovation, and culture-building become more important than the routine, having sufficient fit-for-purpose space will be far more important than maximising workplace density.
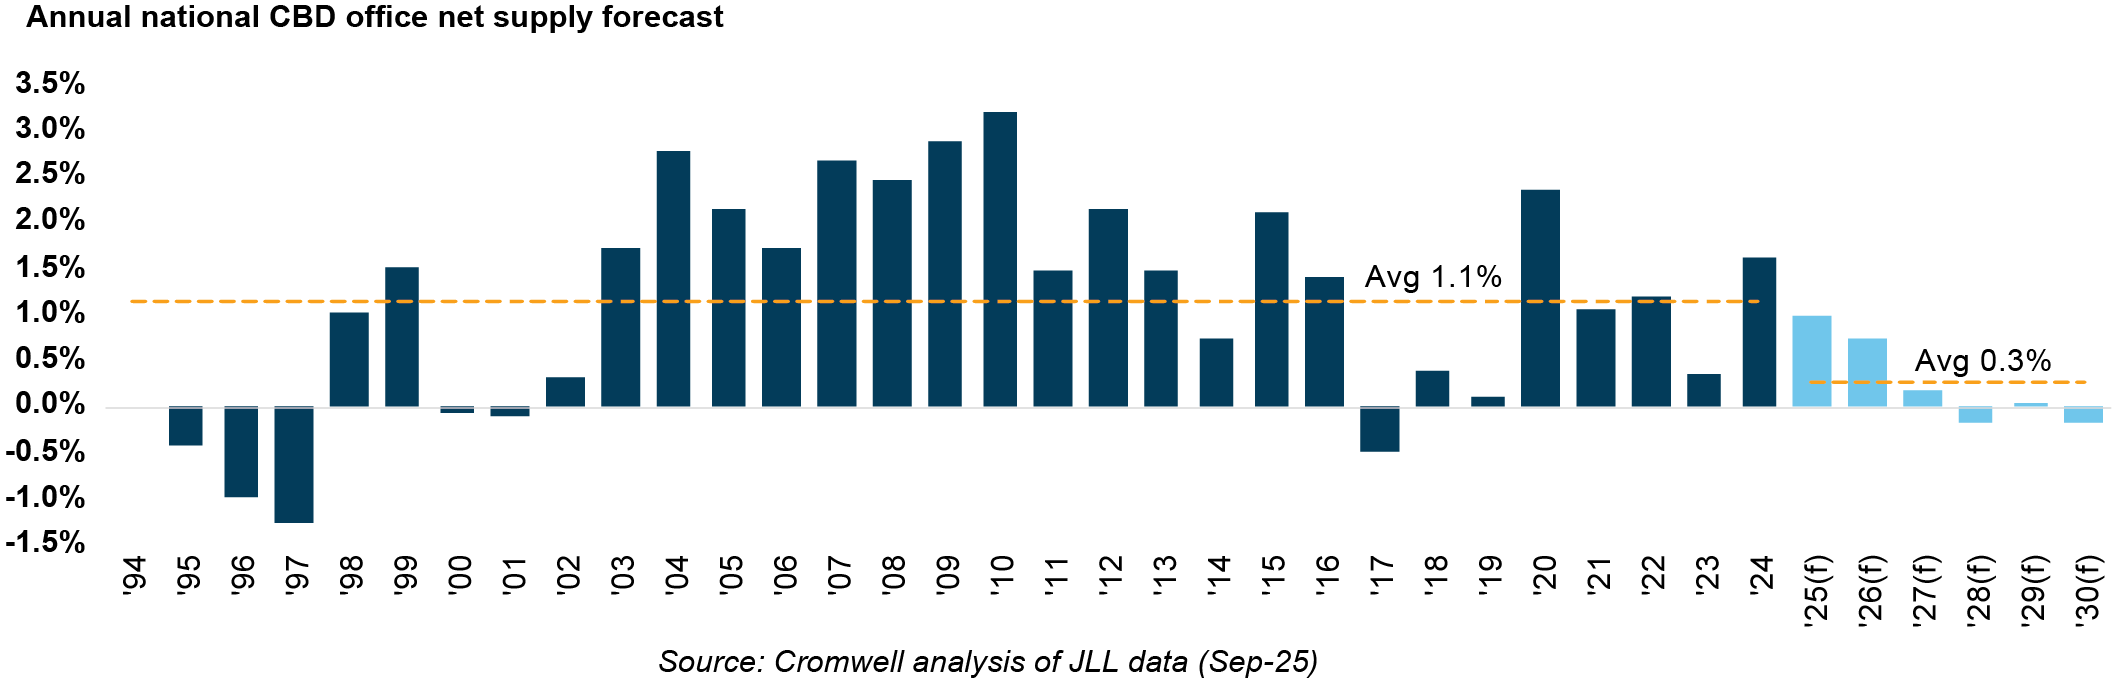
Supply dynamics would also act as a moderating force. Elevated construction costs, tighter financing conditions and feasibility constraints are already limiting new development, reducing the risk that weaker demand outcomes translate into structural oversupply. At the same time, ongoing population growth should continue to support aggregate economic activity and space needs over time, even if AI reduces labour intensity in some functions. Over time, the withdrawal or conversion of obsolete stock would provide further stabilisation.
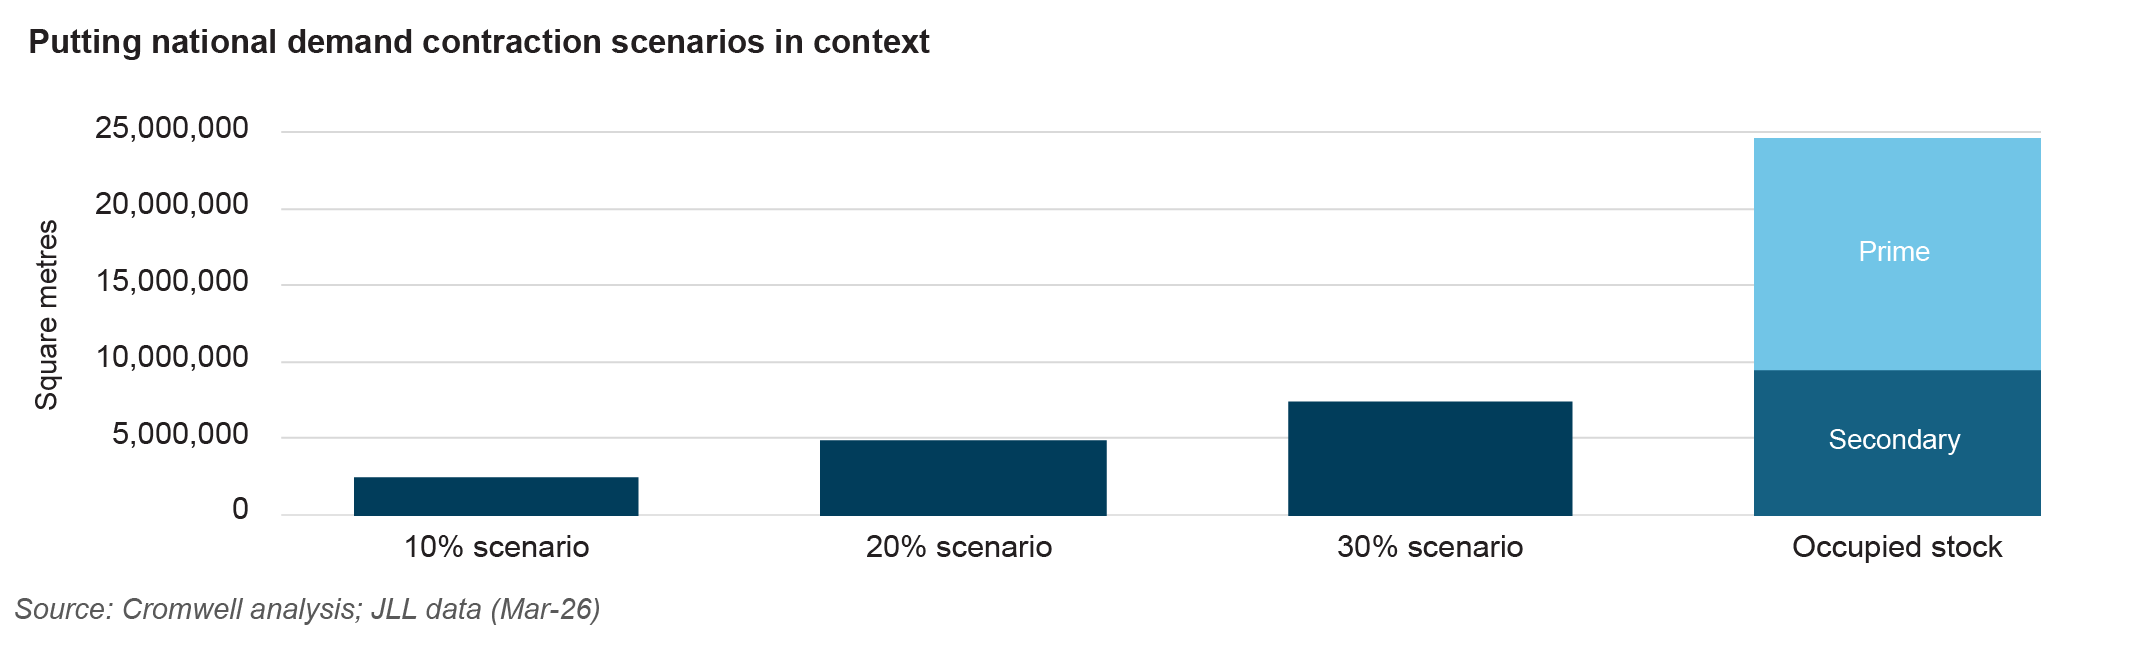
The chart below puts potential downside scenarios into context and illustrates that desirable stock (i.e. prime) should be relatively resilient even in the event of a severe reduction in demand. Flight-to-quality and the withdrawal of secondary assets from the market could, over time, wholly absorb a contraction in excess of 30%. Under such a scenario, investment outperformance would become increasingly dependent on asset selection and the alignment of building attributes and tenant experience with occupier needs.


 As Phoenix Funds marks its 20‑year anniversary, we are revisiting a selection of past investments that continue to offer relevant lessons for investors today. This case study on Sunland Group forms part of our 20:20 Stock Stories series — a retrospective look at listed businesses that illustrate enduring principles of long‑term investing. Sunland Group was an ASX‑listed property developer for much of its corporate life, and Phoenix initiated a position in the company in 2014, remaining invested until its delisting in 2023. While market cycles, sentiment and conditions have evolved over that period, the core themes highlighted by this investment — earnings volatility, management alignment and the importance of after‑tax returns — remain as pertinent today as they were at the time. It is these timeless insights that make the Sunland story worth revisiting and sharing with our investor community.


 1) Negative gearing changes (residential focus)
 The Budget doesn’t rewrite the investment case for commercial property, but it may be considered by market participants to improve


 Liquidity: how markets actually reprice