October 19, 2023
September 2023 direct property market update
Peta Tilse, Head of Retail Funds Management

Peta Tilse, Head of Retail Funds Management
 The quarter started off on positive footing, with inflation across advanced economies edging down to 4.4% YoY in July1. Central Banks’ continued focus on inflation outcomes saw data moderate, helping to ease pressure on rates. However toward the quarter’s end, it was rising energy prices (in part driven by a supply halt by OPEC+) which posed some risk to the inflation outlook and therefore increasing interest rate expectations once again
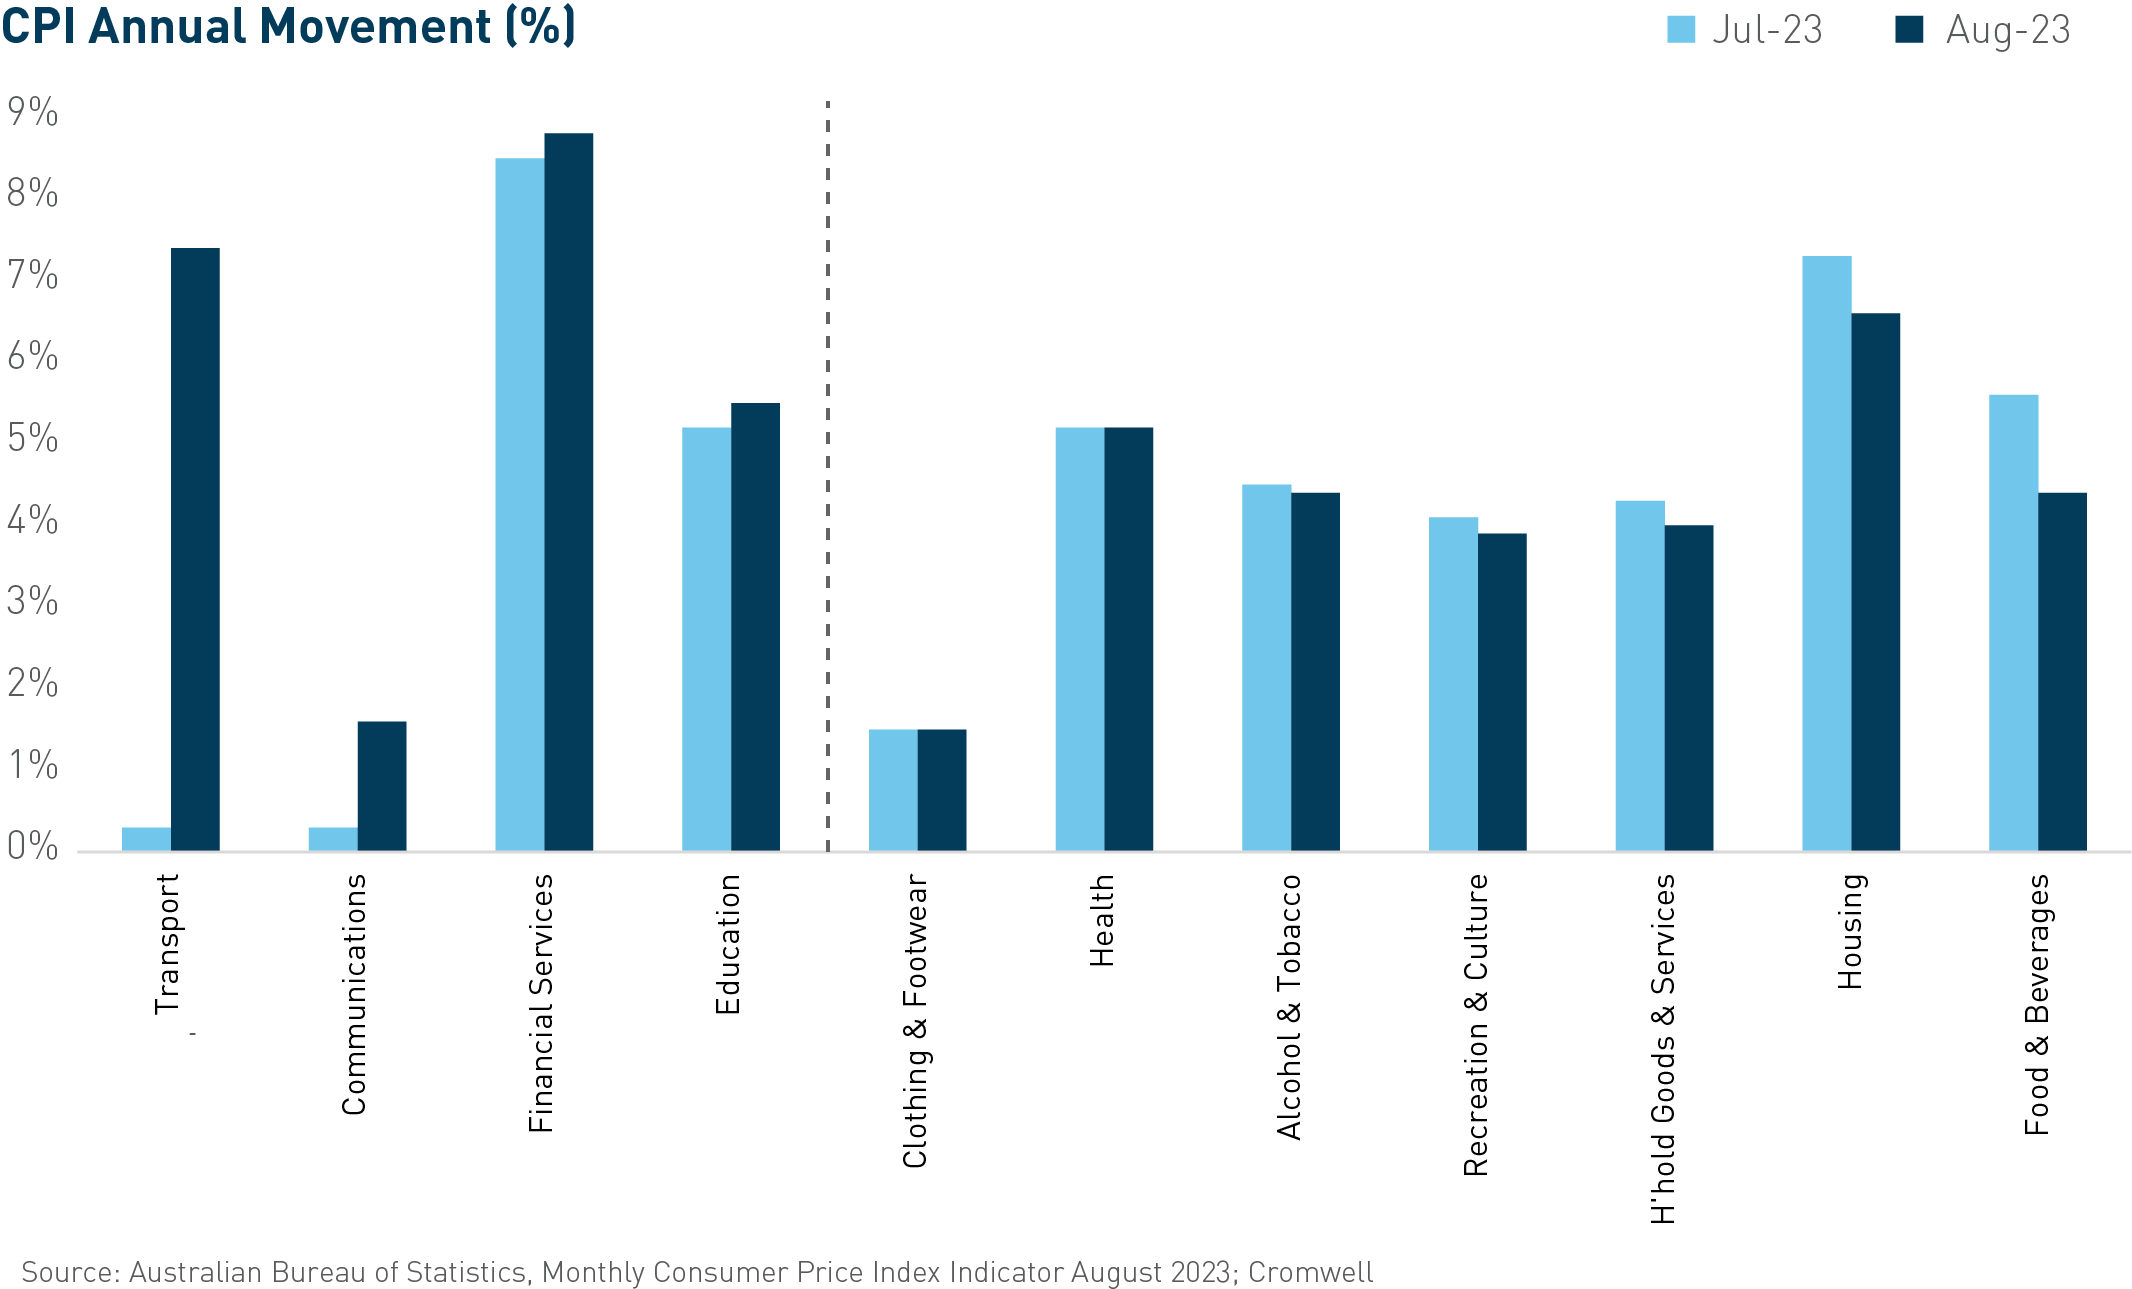
In Australia, the pace of annual inflation slowed in July from 5.4% to 4.9%, before picking up in August to 5.2%2. While services inflation does remain sticky, the August increase is unlikely to be seen as cause for concern by the RBA, namely because it was driven by volatile items such as automotive fuel (up from -7.6% to 13.9%) and holiday travel (5.3% to 6.6%).
Australian bond yields were dragged higher over the quarter by the US, as markets grappled with comments from the Federal Reserve’s Chairman Powell suggesting the Fed’s job is not done, and higher-than-expected Treasury debt issuance.
While the cash rate in Australia did not change over the quarter, market pricing in early October suggested a 34%3chance of a hike. The October meeting of the RBA Board saw a new Governor (Michele Bullock) in charge. The Board elected to leave interest rates on hold (at 4.1%) which was welcomed by the market. Market pricing (as at 9th October) has all but removed the prospect of another move, only ascribing a 5% chance of another 25bps, and signalling that the central bank is almost at the end of the cycle.
 While expectations of further cash rate hikes have diminished, longer term interest rates (proxied by 10-year bond yields) remain ~40bps higher than a year ago4. This is continuing to put pressure on debt costs and is the main macro driver challenging property valuations, despite resilience across demand drivers.
The labour market remains tight, with unemployment staying unchanged at 3.7% in August5 and the number of employed people increasing by 50k over the first two months of the quarter (September data still to come). However, the “quality” of jobs growth was poor, with the number of full-time jobs decreasing by -15.9k over the same period. Leading indicators such as job vacancies and applicants per job advertisement point to slowing jobs growth ahead. Population growth is running at a far stronger pace which should cause unemployment to move beyond 4% before the end of the year, providing support to the view that the RBA hiking cycle may be complete.
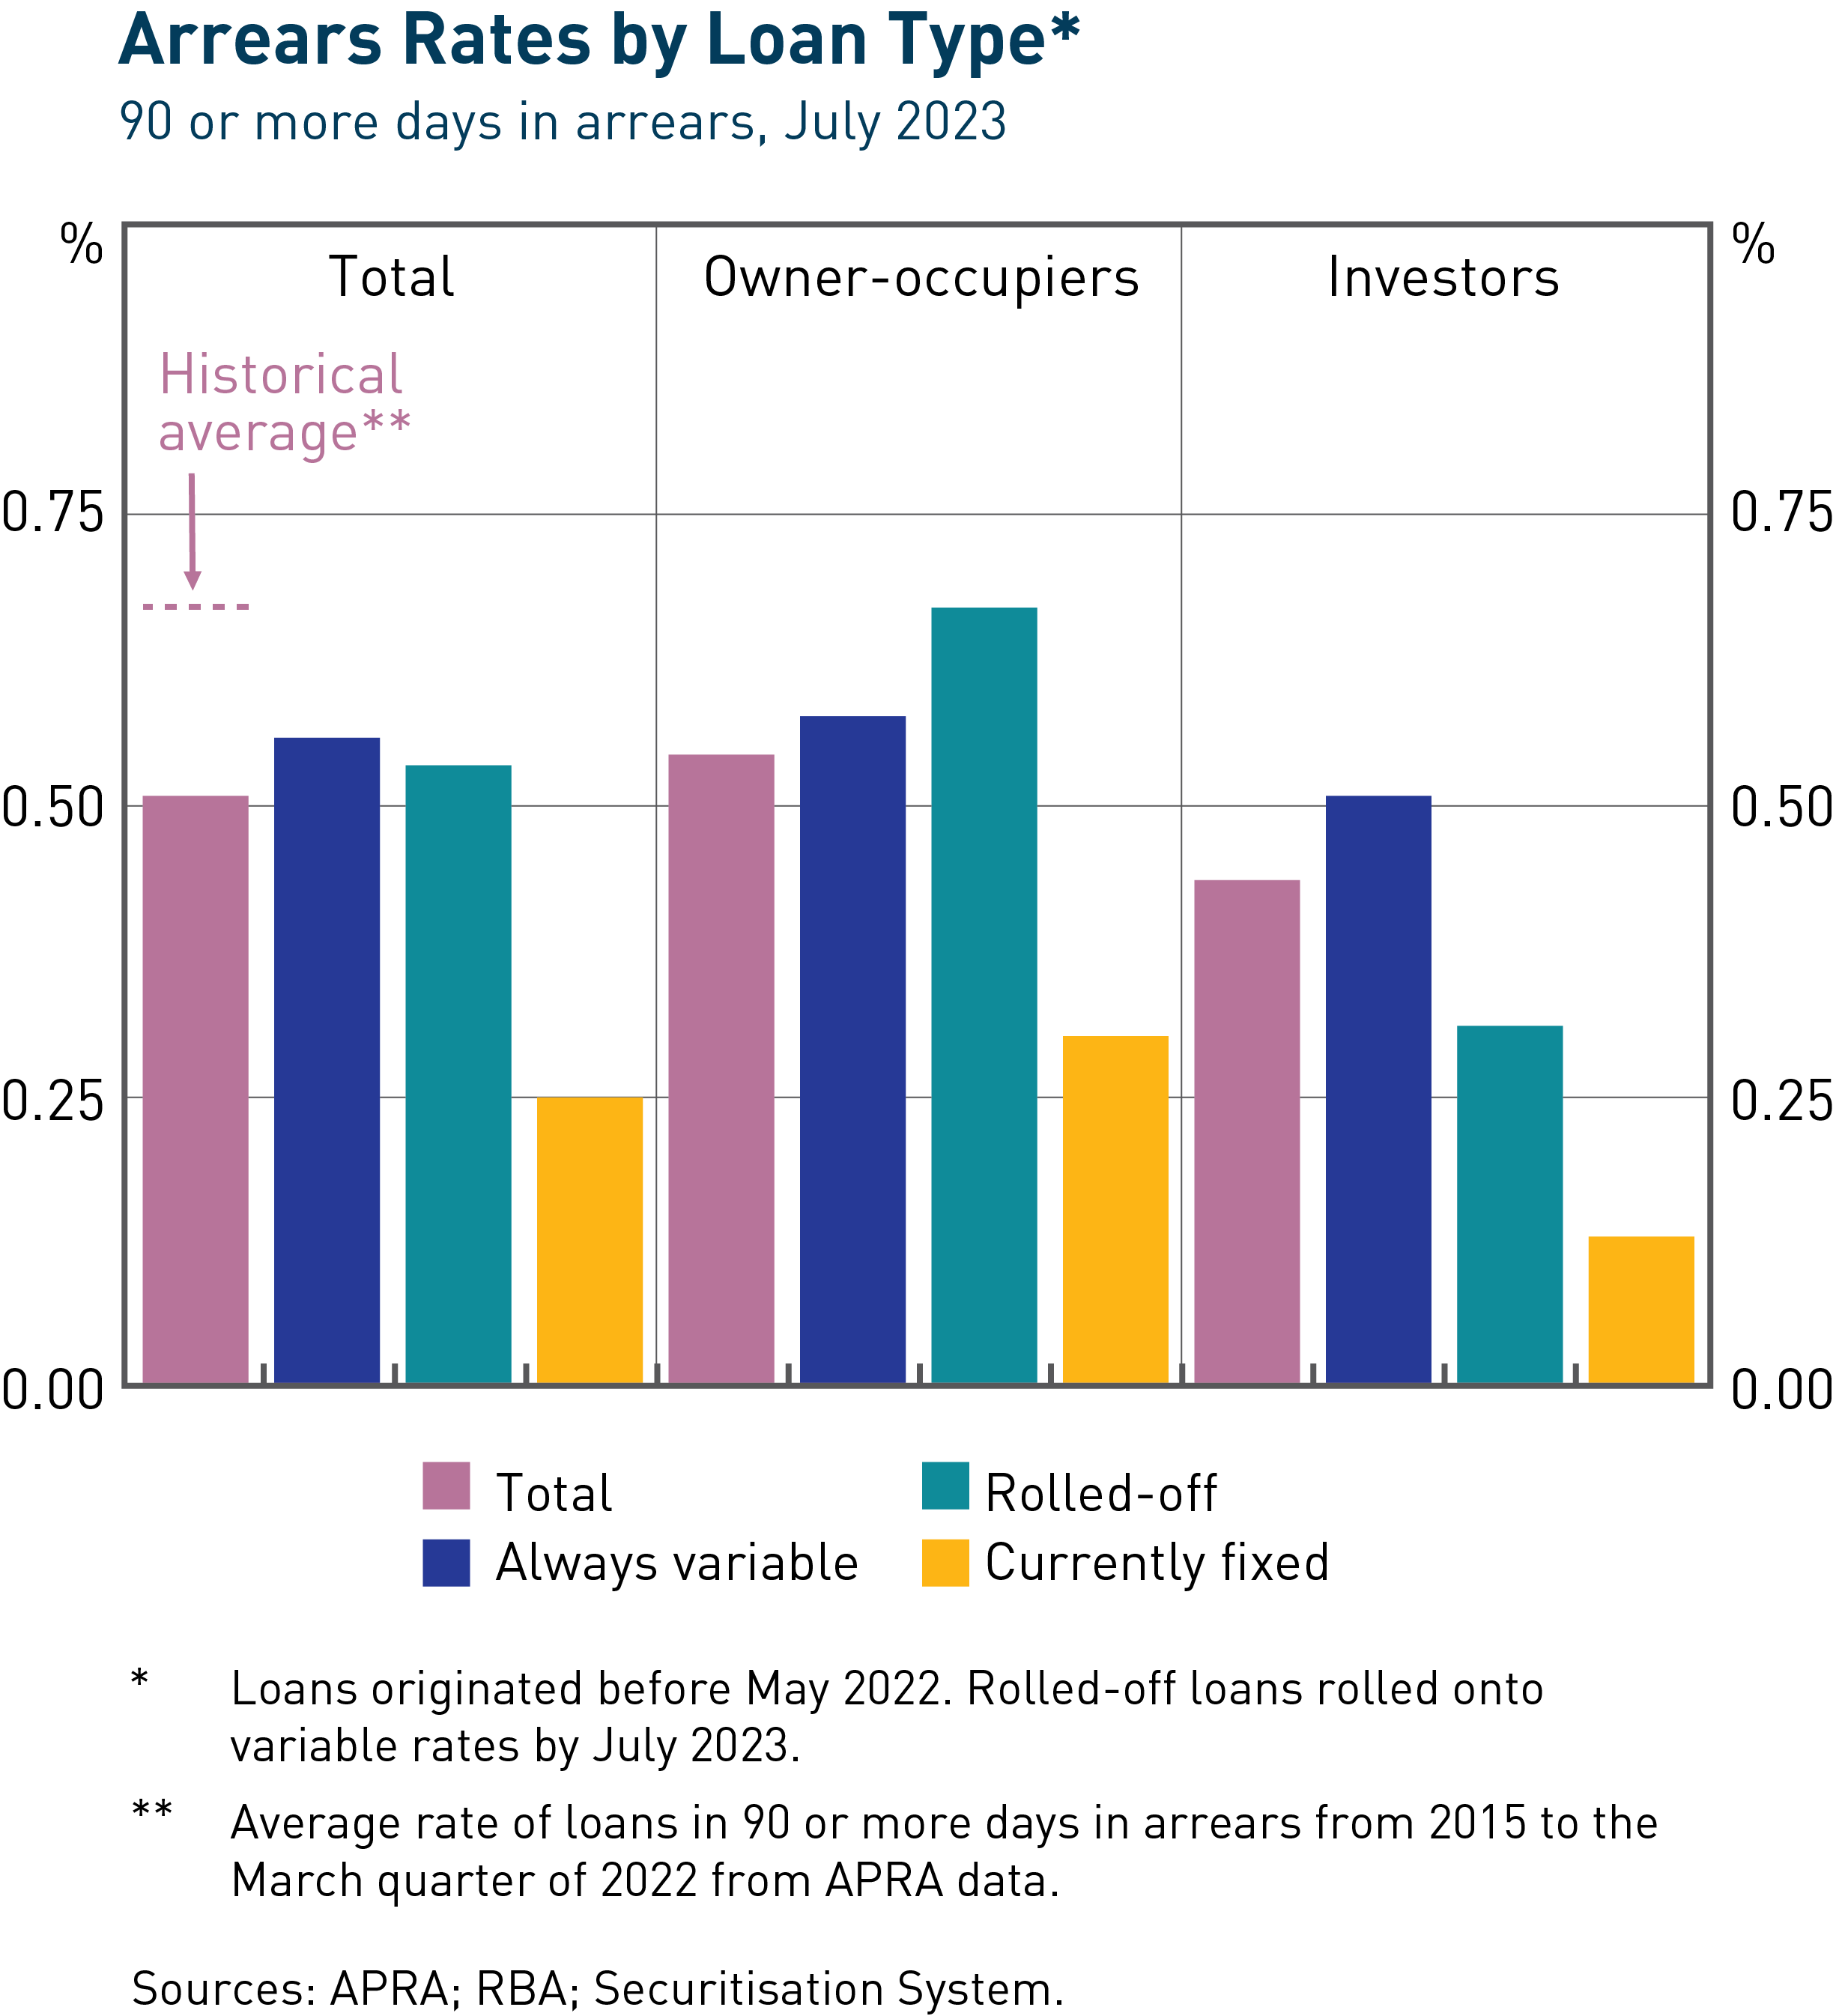
On the consumer front, the impact of higher mortgage rates continues to be the primary concern. The RBA recently released its biannual Financial Stability Review which provides an updated assessment of household resilience and loan serviceability. The fixed-rate “cliff” is generally being managed well, with 45% of fixed loans originated during the pandemic having already rolled off onto higher rates and 90 days arrears rates remaining below historical averages. While risks are clearly most elevated for borrowers with high loan-to-value ratios (>80%), around two-thirds of fixed-rate mortgage holders have liquid savings equivalent to at least 12 months of scheduled mortgage payments6.
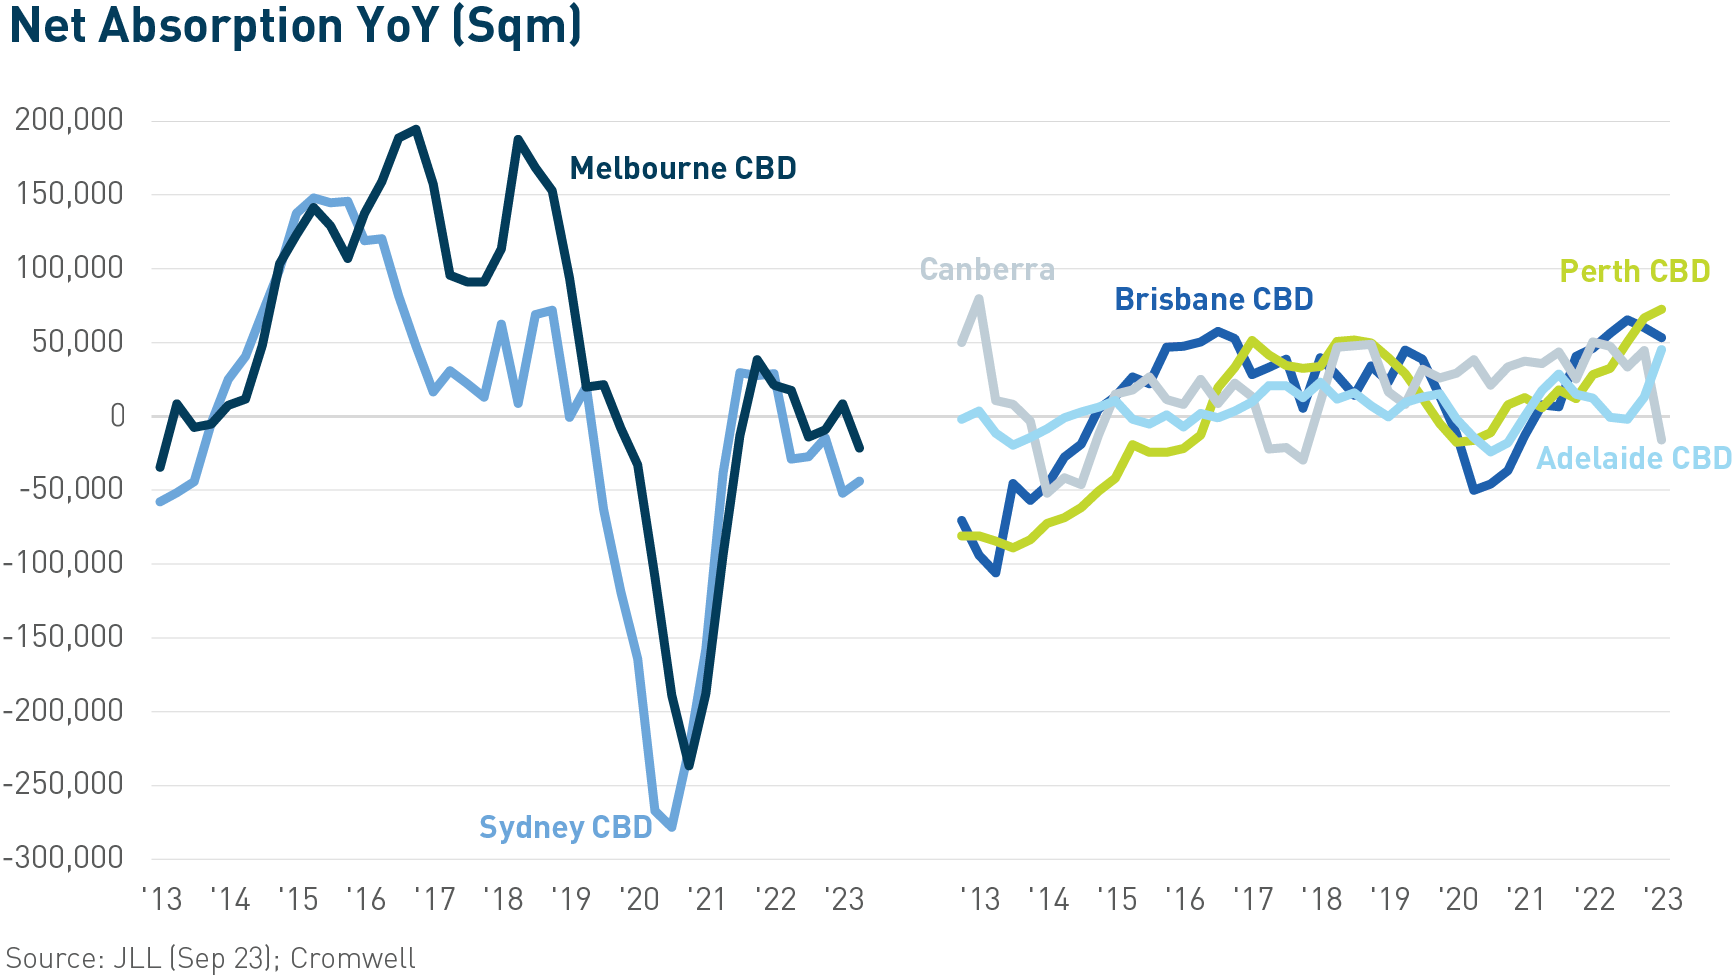 There continues to be mixed demand readings between the major CBDs, largely aligned to the different industry compositions of the markets. According to JLL Research, national CBD net absorption totalled around 1.5k square metres (sqm) across the quarter. The resource-based markets of Brisbane and Perth both continued their run of positive demand, which has now extended to over a year for each. Adelaide recorded the strongest CBD result with positive net absorption of 37.5k sqm, underpinned by the completion of a 40k sqm Prime office building at 60 King William St anchored by Services Australia. Sydney CBD recorded the weakest result on a quarterly and annual basis, with all precincts except the Core contracting over 3Q23. Prime net absorption was stronger than Secondary net absorption for the tenth consecutive quarter, with Sydney and Canberra the only CBD markets recording weaker net absorption across Prime stock.
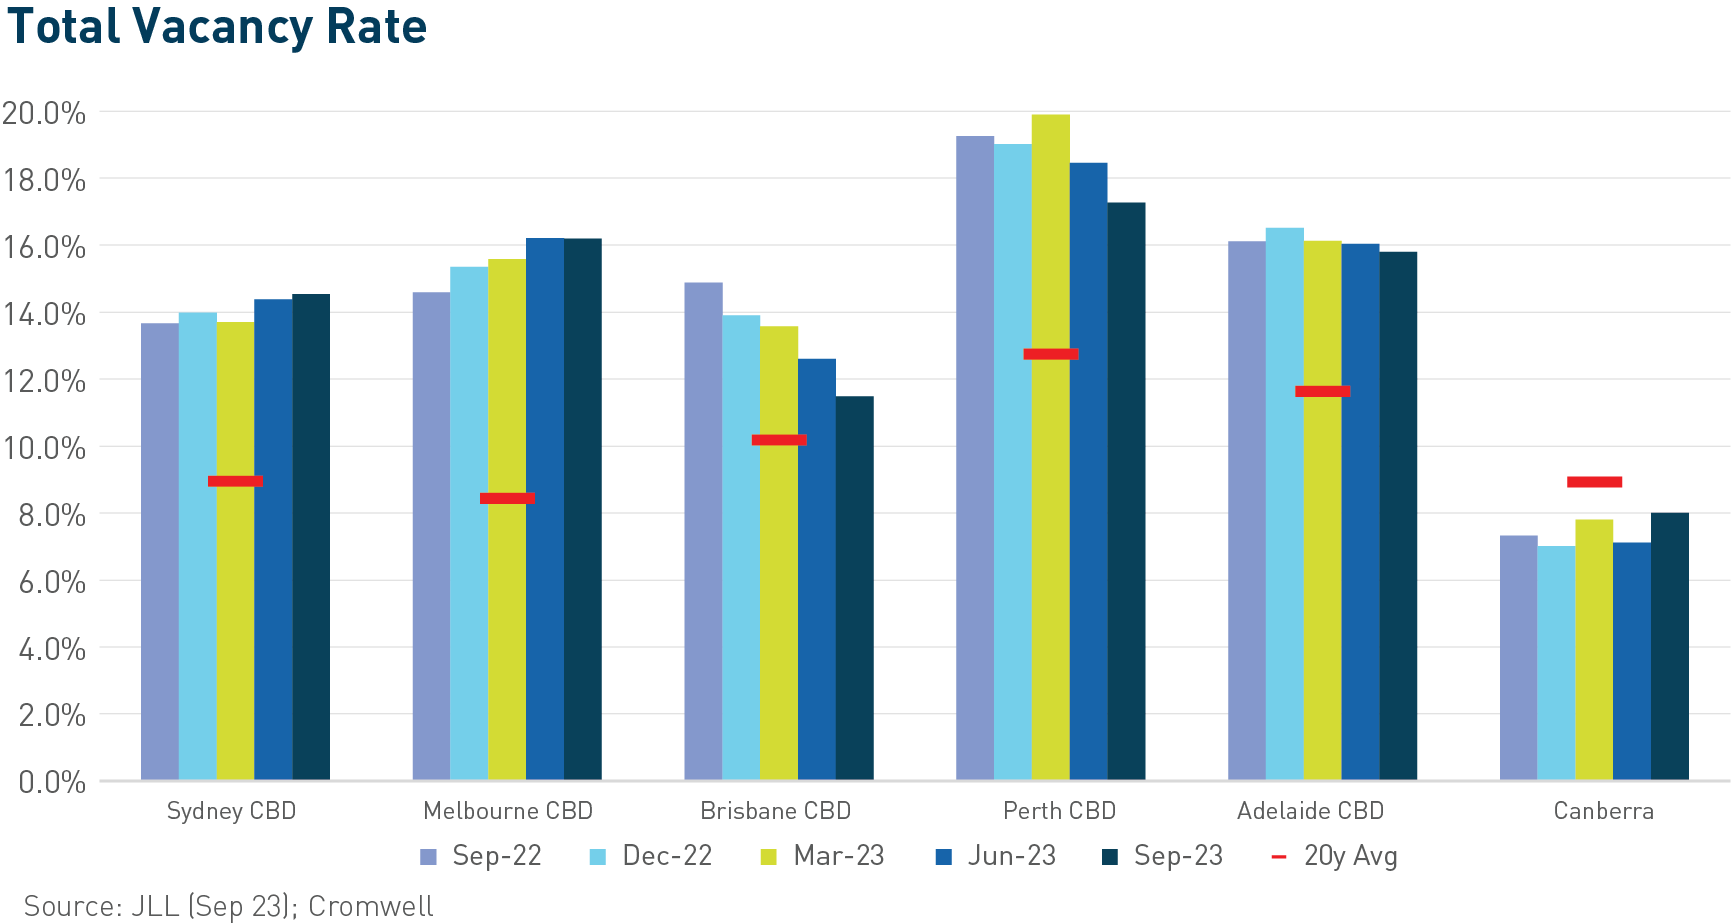
The national CBD vacancy rate decreased slightly from 14.4% to 14.2% over the quarter, with the result following the same pattern as net absorption. Brisbane CBD (-1.1% pts) and Perth CBD (-1.2% pts) both recorded lower vacancy rates, particularly across A Grade stock. Sydney CBD and Melbourne CBD were largely unchanged, with Sydney in particular benefitting from minimal large occupier space handbacks and exits which have impacted previous quarters. Premium stock continues to have the highest vacancy rate compared to the long-term historical average, although much of this vacancy is concentrated in a handful of buildings outside occupiers’ preferred precincts.
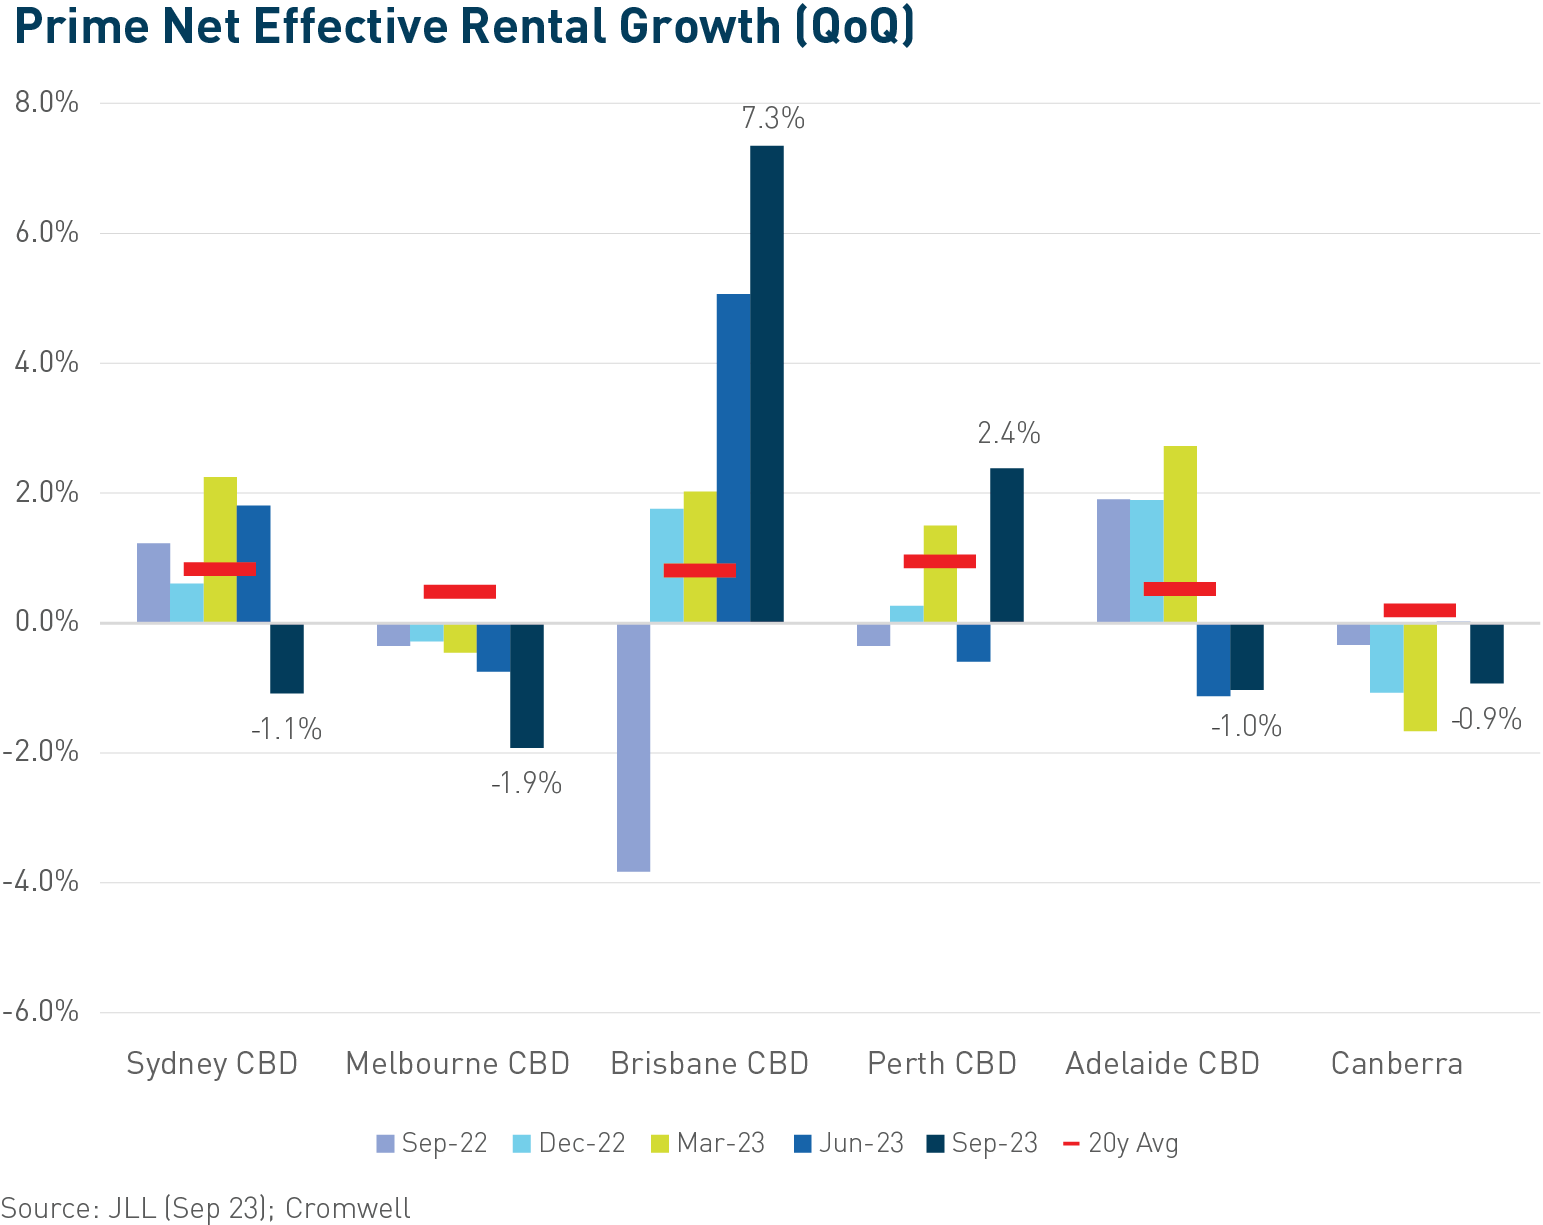
Elevated vacancy and soft demand have caught up to Sydney and Melbourne, with the major CBDs recording weak Prime rental growth outcomes for the quarter. While net face rents continued to grow modestly, incentives increased to record highs (Sydney 35%, Melbourne 41%), dragging net effective rents backwards. The strong demand conditions which have persisted across Brisbane and Perth for some time pushed rents higher again, with Brisbane CBD in particular recording both higher face rents and lower incentives. They are the only CBD markets where net effective rents today are higher than pre-pandemic levels.
Transaction volume ($1.2b nationally) increased significantly from the very weak previous quarter ($0.6b) but remains well down on typical levels. This lack of transaction evidence resulted in average CBD Prime yields expanding by only 9bps, however industry feedback regarding bid-ask spreads for assets currently on market point to further softening ahead. A more substantial expansion of yields is expected in the December quarter when a greater proportion of assets are revalued.
 The impact of higher interest rates is being felt by consumers, with retail sales rising by a modest 0.7% over July and August combined. This was despite positive effects from warmer than normal weather and the Women’s World Cup boosting clothing and dining spending. Annual growth has slowed to 1.5% and with population growth running above 2%, real growth per capita is firmly in negative territory. On an annual basis, dining continues to record the strongest growth, followed by groceries. Tasmania is the worst performing market with nominal sales heading backwards year-on-year, while the ACT has been the top performer with annual sales growth of 5.5%.
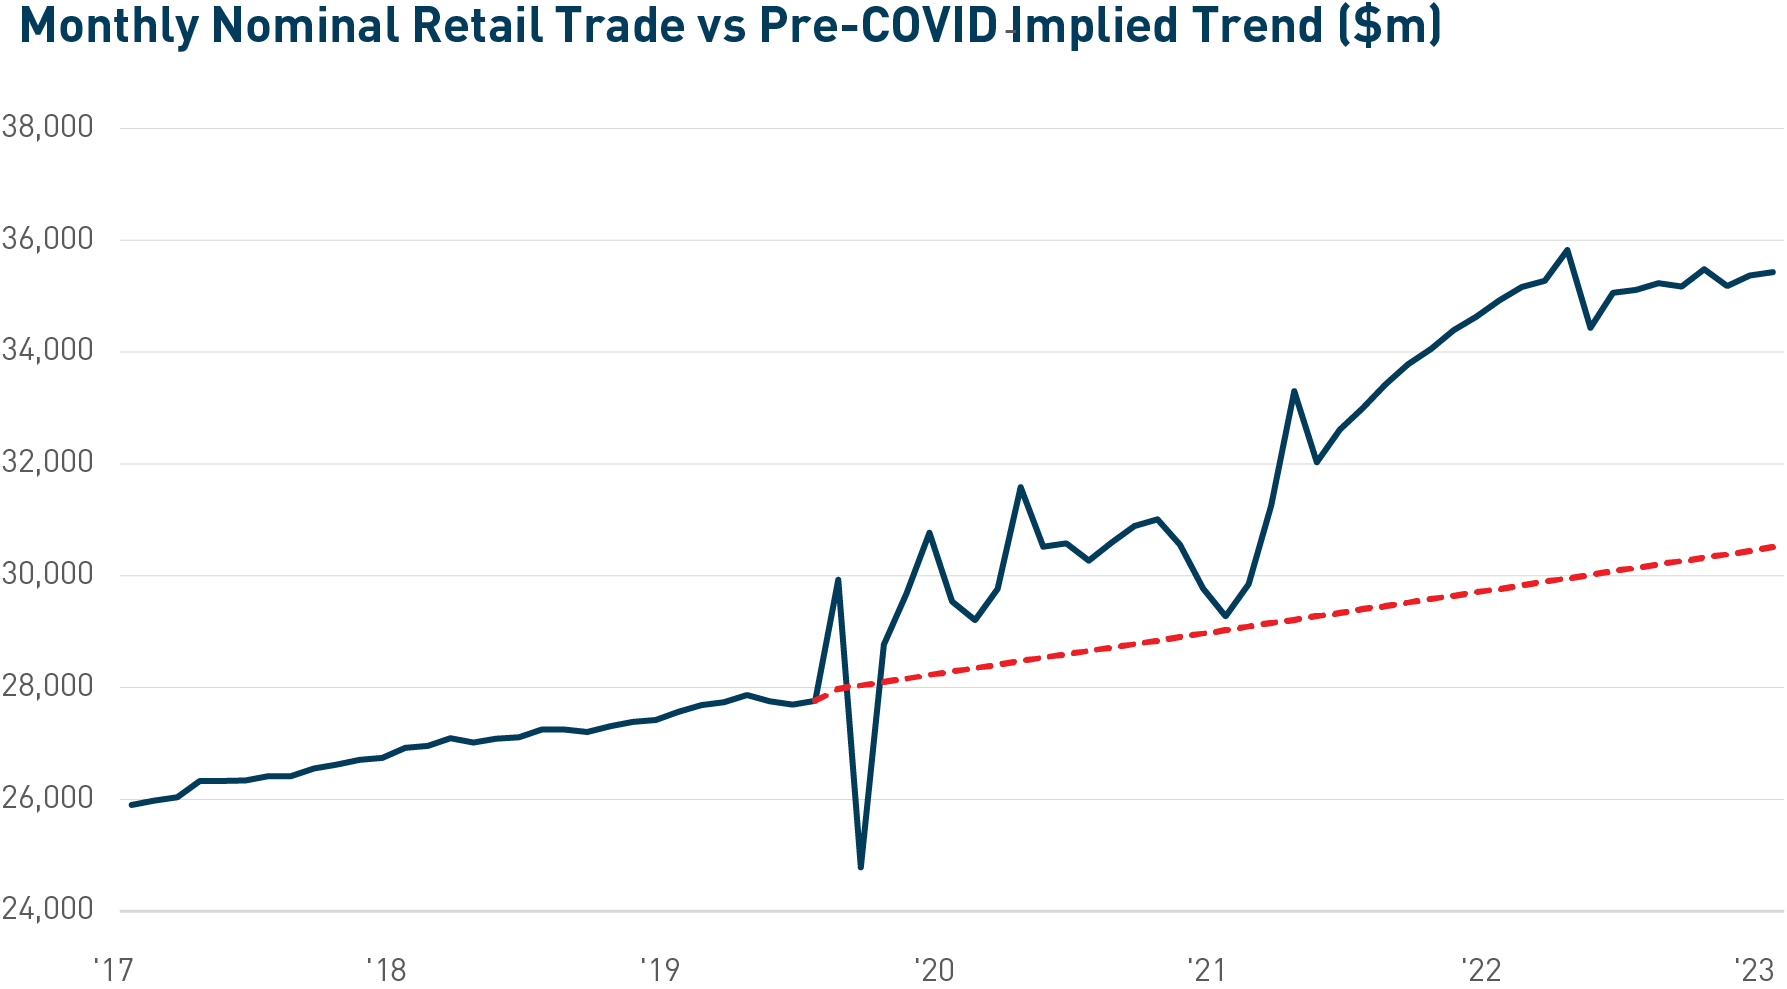
Positively for retail real estate, income growth continues to recover from COVID impacts. Retail sales are still 16% above the level implied by the pre-COVID trend, and leasing activity reflects the outperformance which accrued to tenants over the pandemic period. Retail has not been immune from yield expansion. However, a higher starting yield means the movement is less impactful to valuations on a percentage basis.
While income recovery is strongest across discretionary-focused assets, investors continue to prefer centres underpinned by a strong convenience offering. Assets with a high proportion of income derived from supermarkets or dominant national chains (e.g. Bunnings) are proving attractive.
Industrial continues to generate face and effective rental growth, albeit at a slowing pace. All markets except Perth recorded growth for the quarter, led by Melbourne (+6.9%)7. Prime incentives increased slightly by 1%, and now average 10%. Space take-up continues to be hampered by a lack of available space, but higher pre-lease activity in Sydney and Melbourne lifted demand to slightly below the 5-year quarterly average. From an industry perspective, Transport and Warehousing, Retail Trade, and Manufacturing continue to drive demand, with Transport and Warehousing accounting for 51% of gross take-up over the quarter.
Supply is expected to reach a record level in 2023, with a new record expected to be set in 2024. However, it’s important to note these records reflect delayed completions from previous quarters due to planning, construction, weather, materials, and labour issues. Delivery delays are most likely in Sydney, which together with Melbourne comprised 74% of completions for the latest quarter. There is currently around 900k sqm of stock under construction due for completion in 4Q23, but some of these projects may be pushed into 2024.
Investors continue to pursue allocation to the sector, but transaction activity is being constrained by higher cost of capital and a lack of available stock. There is a clear preference for the more established East Coast markets, which accounted for all income-producing asset transactions greater than $10 million over 3Q23.
The Australian economy remains in a solid position despite global headwinds. Inflation is slowing, employment is solid and population growth will provide support to demand over the course of the year. The rate hiking cycle appears to be nearing its end, financial stability has been maintained, and distress remains contained.
These factors put the Australian commercial property market in good stead from a demand perspective. Businesses continue to adjust size requirements for occupancy as they live with hybrid working, although in certain markets this is now largely known. Experiential workplaces with clever refurbishments and amenity continue to attract and retain quality tenants; something we continue to see within our assets. Location has emerged as the biggest driver of occupier demand and asset performance.
Powerful megatrends such as the need for more sustainable, energy efficient real estate, demographic shifts, and rising demand for segments serving the modern economy such as urban logistics, healthcare and highly amenitised offices will create income growth opportunities.
With the Israel-Hamas conflict adding further uncertainty to geopolitical risks and a soft Australian dollar, capital continues to view Australia as a favourable investment destination. This is because of its attractive demographic profile, growth prospects, and relative social and political stability. However, elevated interest rates, wide bid/offer spreads, and limited transactional evidence have all put pressure on valuations.
Reflecting the good leasing activity in Brisbane, it was a busy quarter for 100 Creek Street, Brisbane with the leasing of speculative suites helping to fit the asset’s occupancy to 88.4%. The Fund’s current WALE (on a look-through basis) is 4.3 years, and occupancy sits at 94.4%.
There were no valuations updates in the quarter for the Fund given the entire portfolio was independently revalued last quarter. With higher interest rates and softer valuations weighing on the Fund, and understanding regular income is important to all unitholders, the Cromwell Funds Management Board made some financially prudent changes in September. These included ceasing to offer redemptions for a period of 6 months, and reducing distributions to 5.75cpu p.a; bringing it in line with expected profit from operations. Other important changes included the addition of a 5% discount to the Distribution Reinvestment Plan. Further details are listed here.
Performance (%) p.a as at 30 September 2023
| Year | Cash (AU) | Bonds (AU) | Shares (AU) | Cromwell Direct Property Fund |
| 1 | 3.56% | 1.61% | 10.9% | -11.0% |
| 3 | 1.36% | -3.92% | 8.55% | 2.31% |
| 5 | 1.28% | 0.34% | 5.08% | 3.48% |
Past performance is not a reliable indicator of future performance. Source: Lonsec and Cromwell Funds Management
1. The Forward View – Global, NAB (Sep-23)
2. Monthly Consumer Price Index Indicator, ABS (Sep-23)
3. RBA Rate Tracker, ASX (Oct-23)
4. Capital Market Yields – Government Bonds, RBA (Oct-23)
5. Labour Force, ABS (Sep-23)
6. Financial Stability Review, RBA (Oct-23)
7. Australia Industrial and Logistics Figures Q3 2023, CBRE (Oct-23)
Read more about Cromwell Direct Property Fund, including where to locate the product disclosure statement (PDS) and target market determination (TMD). Investors should consider the PDS and TMD in deciding whether to acquire, or to continue to hold units in the Fund.