The June quarter was notable for its geopolitical instability, headlined by Israel’s strikes on Iran and the subsequent involvement of the US. While Iran’s parliament voted to close the Strait of Hormuz and impede oil supplies in retaliation, the closure has not been enforced, and Brent Crude prices are only 4% higher than a month ago1 . Tensions have cooled to some degree and economic implications have been limited, however the situation could deteriorate and affect economic growth and/or inflation in the months and quarters ahead.
The other most newsworthy events, since our last market update, occurred after the completion of the June quarter – the RBA’s July rate decision and Trump’s ‘Liberation Day 2.0’. A cautious RBA elected to adopt a “wait and see” approach, going against market pricing and economists’ expectations to keep the cash rate steady at 3.85% in a split vote (6:3). The Monetary Policy Board wanted to see more evidence that inflation is likely to stay within the target band – namely June quarter CPI (released 30 July) and June employment data (17 July). These data points will be released prior to the next RBA decision in August and, absent a shock outcome, are expected to pave the way for the third cut of 2025. The market is now expecting 64bps of cuts over the remainder of the year2.
In its decision statement, the RBA flagged elevated global uncertainty and the unknown final scope of US tariffs and associated policy responses – on this front, there has been little respite. Reciprocal tariff rates were set to come into force on 8 July (US time) following a 90-day suspension, however the pause was extended until 1 August. Adding to the complexity, Trump proposed several new tariffs in early July including a 50% tariff on copper imports, 200% on pharmaceuticals from countries with “unfair” pricing mechanisms, and 50% on all imports from Brazil. These measures do not distinguish between ally or foe, and while the announcements may be negotiating bluster, the resulting uncertainty further diminishes confidence in the US as a stable and reliable investment destination. Fortunately, the RBA has plenty of capacity to stimulate the Australian economy if this global uncertainty leads to softer domestic growth.
Fortunately, the RBA has plenty of capacity to stimulate the Australian economy if this global uncertainty leads to softer domestic growth.
Office
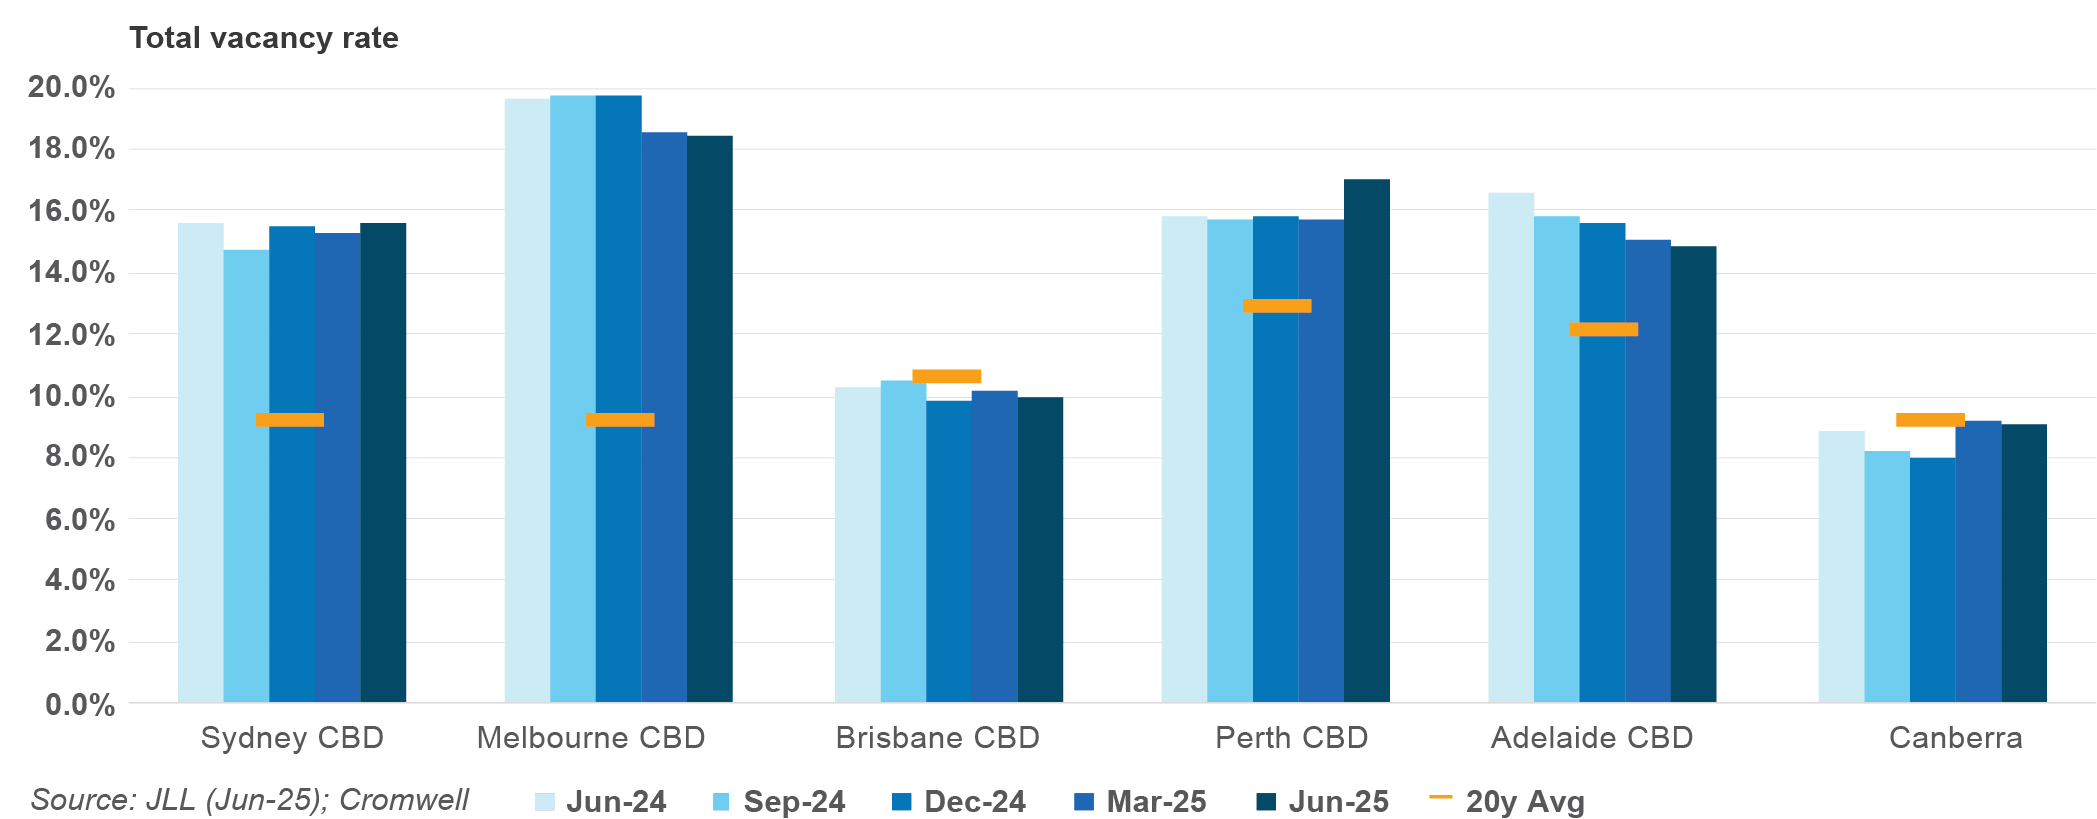
Analysis of JLL Research data indicates nearly 57,000 square metres (sqm) of positive net absorption was recorded across Australia’s major CBD markets in Q2 2025, marking the first quarter since 2021 where all markets saw demand for space grow. National CBD office demand has now been in positive territory for 11 of the past 12 quarters. Sydney CBD was comfortably the top performing market from a demand perspective, with 23,500 sqm of net absorption and 92,400 sqm over the last 12 months. Melbourne’s CBD benefitted from tenants centralising from Fringe markets, while the Brisbane CBD saw a number of large occupiers expand their footprint.
Despite the positive demand result, the national CBD vacancy rate edged 0.1% higher to 15.0% due to supply completions. Perth CBD saw the largest increase in total stock following Cbus/Brookfield’s completion of the premium development ‘Nine The Esplanade’. The rest of the increase in supply largely came from the Sydney CBD market, where a major refurbishment in Circular Quay and a luxury mixed use development were completed. While the vacancy rate increased in these two markets, the Brisbane and Adelaide CBDs both saw a tightening of 0.3% pts. In Canberra, the vacancy rate continues to vary significantly by precinct.
National CBD prime net face rent growth maintained its strong pace (+1.4%), taking annual growth to +6.0%. Brisbane recorded the strongest growth, reflecting the market’s low vacancy rate. Performance was also strong in the Melbourne CBD, where headline rents saw the biggest quarterly jump since 2019. Prime incentives were largely unchanged across all of the CBD markets, with Brisbane CBD (-0.3% pts) and Canberra (+0.3% pts) seeing the biggest movements. This resulted in effective rents – headline rents adjusted for incentives – growing most strongly in Brisbane and Melbourne.
Transaction volume fell to $0.9 billion for the quarter, representing the second-lowest June quarter result since the start of the data series (2007). The weak volume figure was due to a lack of major assets changing hands – the largest transaction this quarter was c$290 million, compared to more than $600 million last quarter. However, on a number of deals basis, this quarter saw more activity than last quarter. From a market perspective, Sydney CBD comprised the greatest share of national volume, while the Brisbane Fringe was the only market where volume exceeded the 10-year average.
There was further evidence that the office valuation cycle is at, or close to, the bottom. Average prime yields were unchanged in every CBD market except Brisbane, where a slight expansion of 6.5bps was recorded.
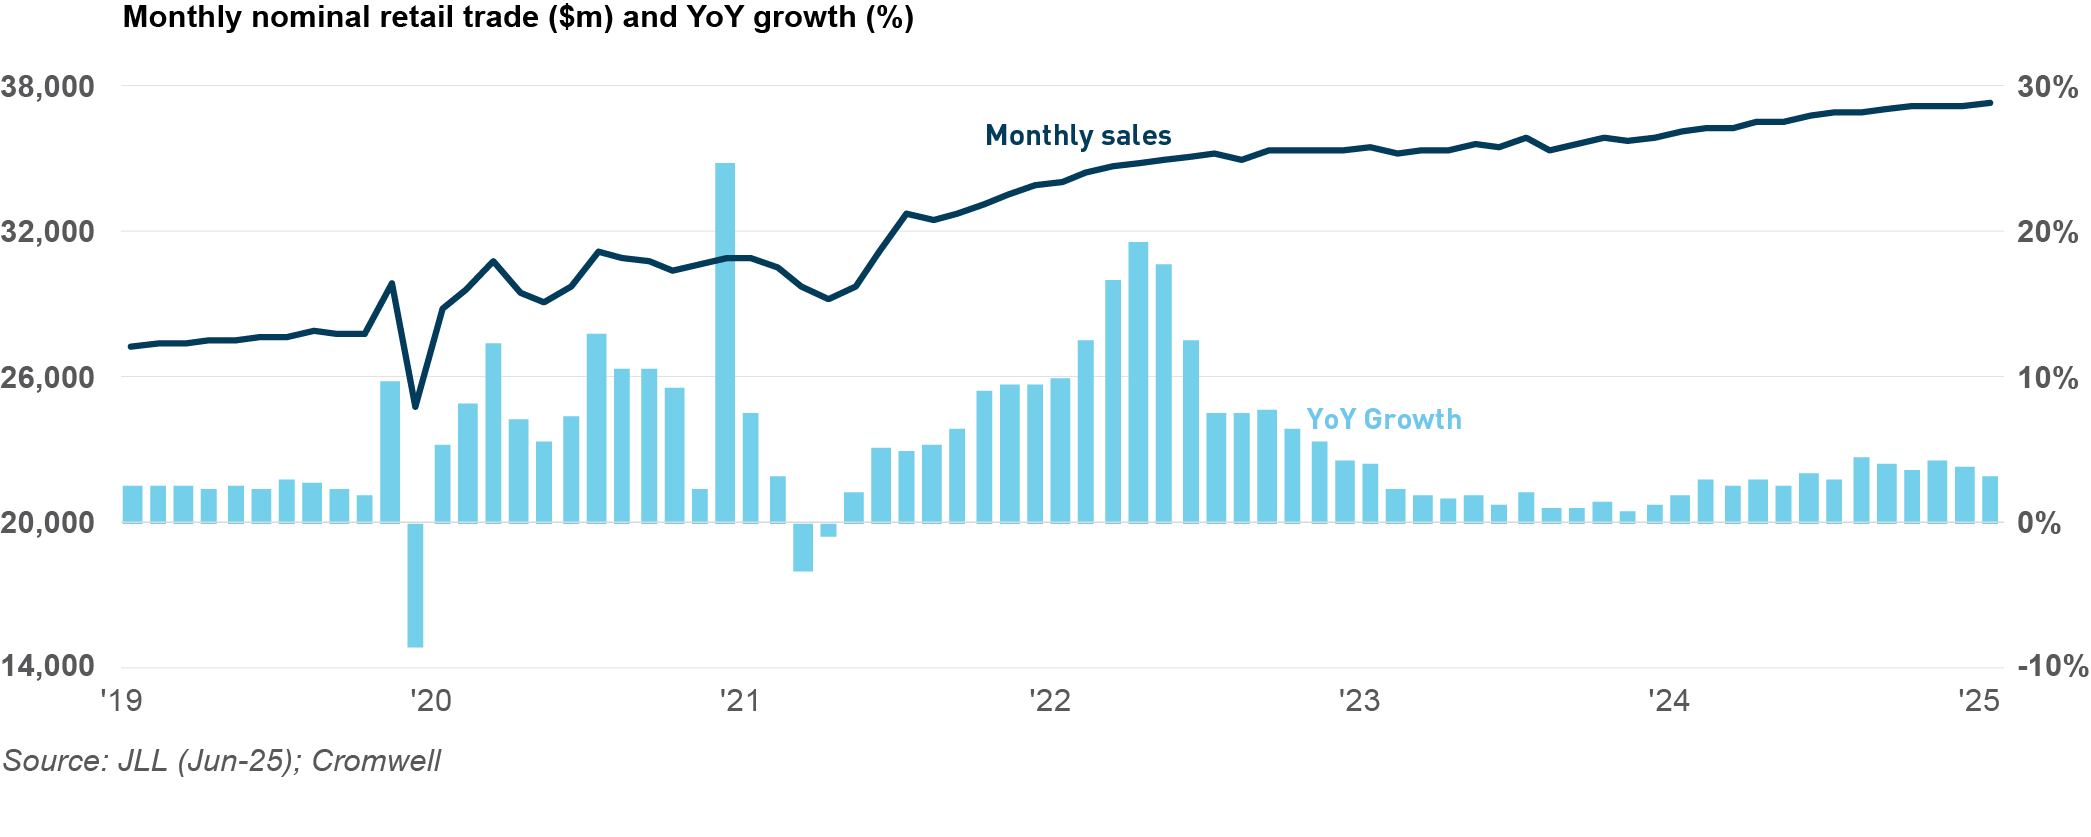
Getting a read on the strength of the consumer has become more challenging over recent months, with Cyclone Alfred (March), and the unusual timing of the Easter/Anzac Day long weekends both introducing some noise in the data. Purchases of winter clothing supported growth in the most recent monthly data (May), however the pace of growth continues to lag expectations. With the RBA choosing to remain on hold, the drag of consumer pessimism may persist a while longer.
Positively for retail real estate, the biannual vacancy rate was largely unchanged over the last six months. Regional shopping centres saw vacancy decrease from 1.6% to 1.5%, while Neighbourhoods saw a significant decrease of 0.8% pts from December to June. These improvements were offset by a large increase in vacancy rate across the Sub-Regional centre type. From a market perspective, conditions tightened across every centre type in Sydney, while Melbourne was the main driver of higher Sub-Regional vacancy.
Supply remains muted with only 13,600 sqm of Neighbourhood space added to national core retail stock over the quarter. The limited supply pipeline is supporting retail fundamentals, however rents were largely unchanged over the latest quarter. On an annual basis, growth has been strongest in S.E. Queensland.
Retail transaction volume strengthened again over the quarter to total $2.4 billion. The resulted was buoyed by the Neighbourhood sub-sector which recorded its second biggest quarter of deal volume in history at just over $860 million. The elevated volume was skewed by the $450 million sale of St Ives Shopping Village, an unusually large transaction which included some adjoining residential properties and presents development potential. Large Format Retail continued to record elevated deal volume, with significant single tenant assets such as IKEA, Costco, and Bunnings, comprising the majority of this quarter’s activity.
Sub-Regional yields compressed across every market except S.E. Queensland. This centre type has seen the biggest recovery in yields since pandemic highs, and pricing is now approaching pre-COVID levels. Neighbourhood yields also decreased in Perth, while there was no movement across the Regional shopping centre type.
Occupier take-up (gross demand) was in line with last quarter at nearly 800,000 sqm. Transport & Warehousing was the main driver of the result with over 300,000 sqm of gross demand recorded. It was also a solid result across Retail & Wholesale Trade, with demand underpinned by Kmart’s preleasing of a new major distribution centre at Sydney’s Moorebank Intermodal Precinct. This leasing deal contributed to Sydney demand outpacing its five-year average and comprising nearly 40% of national take-up. Perth was the only other market to outperform recent history, with a number of occupiers expanding into larger premises.
Rent growth slowed significantly over the quarter with 16 of 22 markets staying unchanged compared to March. All precincts across Sydney and Perth were flat, while the South East was the only sub-market in Melbourne where rents grew (+0.6%). Adelaide also only had one precinct record growth, the Outer North, which was the top performer nationally (+3.3%). Adelaide has comfortably been the top performing market over the last 12 months, but it was Brisbane that topped the growth charts in June with average growth across its three precincts rising to 1.8%. There was a slight increase in prime incentives in select markets along the East Coast.
Just over 800,000 sqm of supply was completed over the quarter, around 30% more than the quarterly average of the past five years. While supply was below average in Melbourne and Perth, Adelaide saw its second largest quarter of development in history. There is currently nearly 950,000 sqm of space under construction and due to complete in 2025. Even if all of these projects are delivered on time, 2025 will see the lowest level of new supply since 2021. Additionally, actual delivery may slip into subsequent periods given construction delays are persisting.
Industrial transaction volume strengthened after last quarter’s unusually soft showing, totalling over $2.4 billion across 90 deals. Brisbane was a standout as Chinese e-commerce giant JD.com made its first industrial investment in Australia – the Wacol Logistics Hub – for around $250 million. Adelaide also saw elevated transaction activity with the dollar volume running 33% higher than the quarterly average of the past five years. Strong demand for Brisbane assets was reflected in market yields, which compressed by 12-20bps across its three precincts. Perth saw the largest movement in yields with every precinct compressing 25bps, while Sydney and Adelaide also recorded some instances of compression.
Sign up to Insight Magazine
Stay informed about investing strategies, finance news, property market updates, and more by signing up for Insight. Build a solid foundation of investment knowledge to help you make the right investment decisions and guide you in planning your investment journey.
The global economy moved from alert to alarmed when higher-than-expected tariffs were announced in early April. While the ultimate trajectory of trade policy remains a key uncertainty, market anxiety has eased somewhat in recent months as Trump has signalled a readiness to back down if economic conditions deteriorate too sharply. Economists now expect the worst-case scenarios to be avoided, however growth is forecast to be weaker than if trade destabilisation had not occurred.
Australia is somewhat insulated from the impacts of global volatility. Most attention domestically is focused on the RBA and its willingness to stimulate the economy. Growth green shoots were seen in 2024, but momentum has slowed, particularly in consumer-oriented sectors. If a more supportive monetary policy environment is not delivered soon, the transition of the economy from public sector demand to private business investment may become bumpy.
The commercial property market continues to stabilise, with improving sentiment evident in both capital flows and leasing fundamentals. Office appears to have reached an inflection point, while retail and industrial pricing continues to firm. As confidence returns to the asset class and institutional capital re-engages, identifying compelling opportunities will increasingly depend on a deep understanding of asset quality and positioning.
How did the Cromwell Funds Management fare this quarter?
Cromwell Direct Property Fund (DPF, the Fund)
The entire DPF portfolio underwent a valuation in advance of the Fund’s Liquidity Event. Compared to prior valuations completed between June and October 2024, the six directly held assets fell by 0.60%. Two assets saw an uplift and one remained flat, primarily due to strong rental growth across Queensland markets.
Considering DPF’s partial ownership of Energex House in Brisbane (Cromwell Riverpark Trust), and the ATO building in Dandenong (Cromwell Property Trust 12), the total change was just 0.90%. Energex House remained flat, while the ATO building declined by 13%, attributed to a 1% increase in the capitalisation rate. This adjustment was made by the independent valuer based on comparable sales evidence in the Melbourne office market.
As at 30 June, DPF’s portfolio, now valued at $537.2 million on a look-through basis, is 96.6% occupied with a weighted average lease expiry of 3.4 years.
Most assets within the DPF portfolio are multi-tenanted buildings, with a significant concentration located in Brisbane. In the current market, particularly in Brisbane, we continue to observe strong effective rental growth. The portfolio’s shorter Weighted Average Lease Expiry (WALE) presents a strategic advantage, enabling the Fund to capitalise on rental reversion opportunities as leases expire and are renegotiated.
This staggered lease expiry profile allows space to be progressively repriced to current market rates, supporting earnings growth. Additionally, the shorter WALE provides flexibility to reposition assets and attract higher-paying tenants, further enhancing the portfolio’s income potential and long-term value.
Just under half of the gross passing income is derived from Government and Listed companies or their subsidiaries. Cromwell’s asset management team have negotiated over 10,000sqm of leasing this financial year across 23 transactions, with several larger deals currently in advanced stages of negotiation. The largest completed deals occurred at 545 Queen Street in Brisbane, including a 6-year lease on over 2,100sqm to a new tenant, and a 2-year lease extension on 1,600sqm to an existing Federal Government tenant.
Cromwell Property Trust 12 (C12)
Cromwell Property Trust 12 is nearing the end of its second term in October this year. In September, investors in C12 will receive a Notice of Meeting and Explanatory Memorandum, which will propose an extension of the Fund’s term through to December 2027. The Explanatory Memorandum will contain market data and commentary to help investors decide whether they wish to extend the trust term or take the asset to market. The ATO building remains 99.3% leased, with only minor ground floor vacancy and a WALE of 5.1 years. Since its inception in 2012 with an initial portfolio of three assets, C12 has delivered strong performance. Despite recent valuation adjustments, the Fund has achieved an equity internal rate of return (IRR) of approximately 11.7%, reflecting its long-term success.
Footnotes
Cromwell analysis of MarketWatch data (9 July)
ASX (8 July)
About Cromwell Direct Property Fund
Read more about Cromwell Direct Property Fund, including where to locate the product disclosure statement (PDS) and target market determination (TMD). Investors should consider the PDS and TMD in deciding whether to acquire, or to continue to hold units in the Fund.
The S&P/ASX 300 A-REIT Accumulation Index gave back some of the gains seen in the previous quarter, dropping 6.1%. Property stocks underperformed …


 How did the Cromwell Funds Management fare this quarter?