As was often the case over 2025, geopolitics continue to cloud the economic outlook, with the U.S. military operation in Venezuela on 3 January the latest example. Financial markets have largely been unaffected to date, reflecting Venezuela accounting for less than 1 per cent of global oil production (despite holding the world’s largest reserves)1. However, the longer-term implications remain unclear, and subsequent comments regarding the future of Greenland’s sovereignty have added to uncertainty. While the direct implications for Australian real estate are limited, second-round effects could emerge through lower global growth, heightened market volatility, exchange rate movements, and any resulting shift in the inflation outlook – particularly if the U.S. dollar’s safe haven status were to diminish.
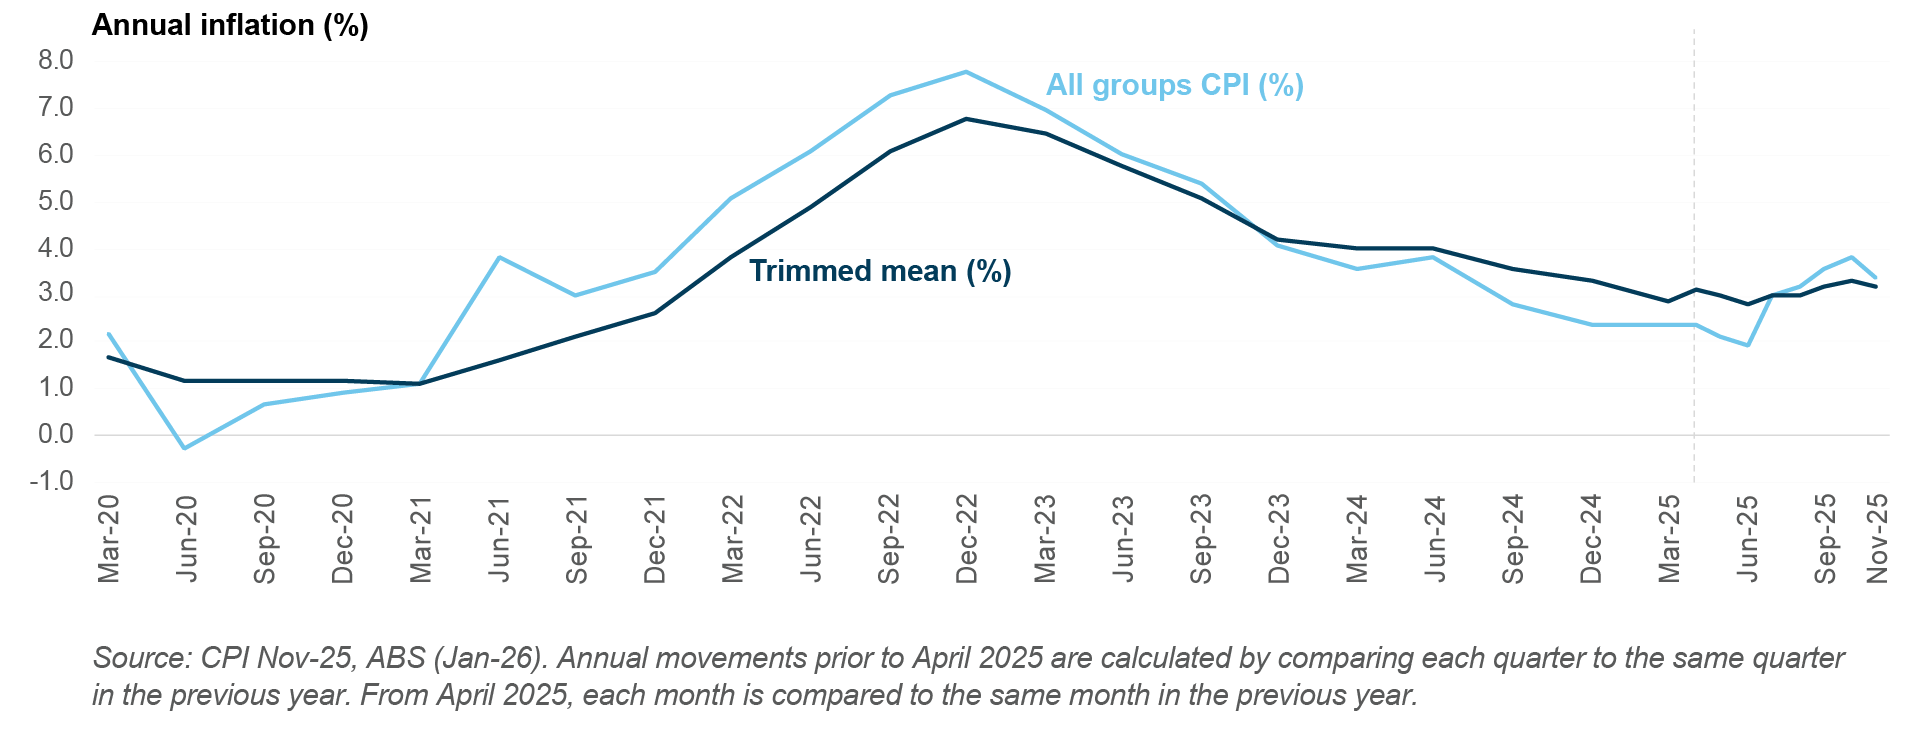
On the inflation front, CPI continued to print higher than expected over the final months of 2025. This data saw cash rate expectations shift, with the market pricing 45bps of hikes in 2026 as at 2 January2. The most recent CPI data, released 7 January, showed the pace of annual inflation slowing from 3.8% (October) to 3.4% (November)3, an outcome which was below market expectations (3.6%). While the moderation was welcome and slightly tempered both market expectations for rate hikes and long-term bond yields, it was largely driven by volatile categories such as electricity and holiday travel. Underlying price pressures remain, and the RBA will likely want to see several periods of downwards trend before considering the prospect of rate cuts.
Beyond inflation, cooling house prices and auction clearance rates may provide some confidence that current monetary policy settings are restrictive, but it is the labour market which will carry the greatest weight in the RBA’s deliberations. The unemployment rate has been steady at around 4.3% for the past six months4, but job vacancies, underemployment, and hours worked indicators do suggest conditions are slowly becoming less tight. Both the Labour Force (22 January) and CPI (28 January) data releases will be critical in guiding whether the RBA is likely to remain on hold or hike at its next meeting in early February – economists are currently split, with two of the major banks expecting no change and two expecting a 25bps increase to the cash rate.
Net demand was positive for the eighth consecutive quarter, with occupied space increasing by nearly 44,000 square metres across the major CBD markets in the final three months of 2025. Sydney CBD recorded the strongest increase in net demand for the third consecutive quarter on a square metre basis. Australia’s largest office market benefitted from strong A-grade net absorption, with large financial and professional services occupiers leasing space across several buildings in the Midtown precinct. On a percentage basis, Adelaide CBD was the top-performing market with occupied stock increasing by 1.0%, also driven by large occupiers. Canberra was the only major market to record a contraction of occupied stock over the quarter, due to the consolidation of a federal government department’s office footprint. The rankings and performance of the major CBD markets in the final quarter were consistent with the results recorded on an annual basis over 2025.
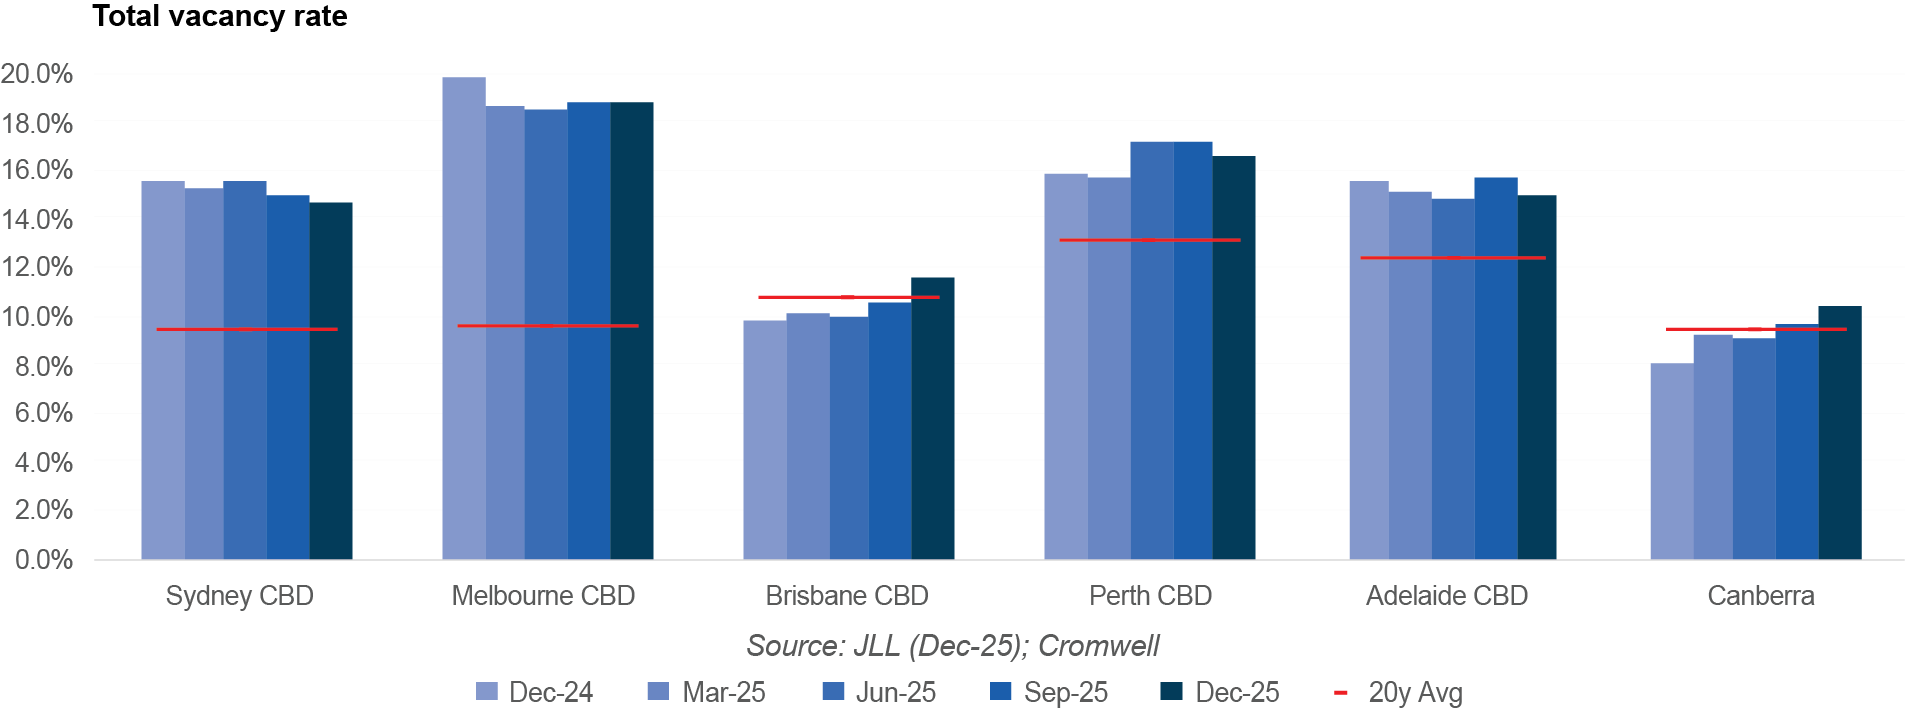
The national CBD vacancy rate was unchanged over the quarter as new supply completions offset higher net demand. Adelaide CBD vacancy decreased from 15.7% to 14.9% reflecting the strong leasing performance over the quarter and an unchanged total stock level. Brisbane CBD saw the biggest increase in vacancy rate (+1.0%), as a partially vacant new Premium building reached completion. While Brisbane CBD vacancy has increased over the last two quarters, it has not been due to shrinking demand but rather the biggest calendar year of supply since 2012. Positively, no supply is expected to be added to the Brisbane CBD market in 2026, which in our opinion will put downwards pressure on vacancy and be supportive of rental growth.
National CBD prime net face rent growth accelerated to +1.5% for the quarter and +6.3% for the calendar year, the strongest pace of annual growth in eight years. Brisbane CBD led the way with quarterly growth of +2.6%, duly supported by Canberra and Sydney CBD. On an annual basis, the pace of growth accelerated in every major market except the Perth and Adelaide CBDs. Prime incentives were largely unchanged over the quarter, Brisbane CBD the exception with a decrease of 80bps. This improvement drove a strong outcome in Australia’s top-performing office market, with Brisbane CBD annual prime net effective rent growth hitting double digits for the 10th consecutive quarter. Prime rent growth continues to outperform rent growth across lower quality assets.
National office transaction volume exceeded $4 billion over the final three months of 2025, representing the strongest quarter of dealmaking since interest rate hikes put the brakes on real estate liquidity in 2022. Activity was headlined by Commonwealth Superannuation Corporation taking full control of Grosvenor Place (Sydney CBD), and GPT’s subsequent acquisition of 50% of the asset. Brisbane and Canberra also recorded transaction volume greater than the 10-year average, with Brisbane’s figures driven by a recovery in the number of deals. Average prime yields were unchanged in every major market except Melbourne CBD, which saw a small expansion over the quarter.
Improving household wealth and income have continued to flow through to consumption despite consumer sentiment remaining in pessimistic territory. Household Spending Indicator data for October, the most current at time of writing, showed the strongest monthly growth in spending since early 2024 and the strongest annual growth since late 2023. The Clothing and footwear category was the top performer over the month, a positive for Regional shopping centres which have a higher weighting to discretionary consumption. Non-discretionary consumption delivered stronger growth on an annual basis, with spending in the grocery sub-category increasing +7.0% year-on-year6.
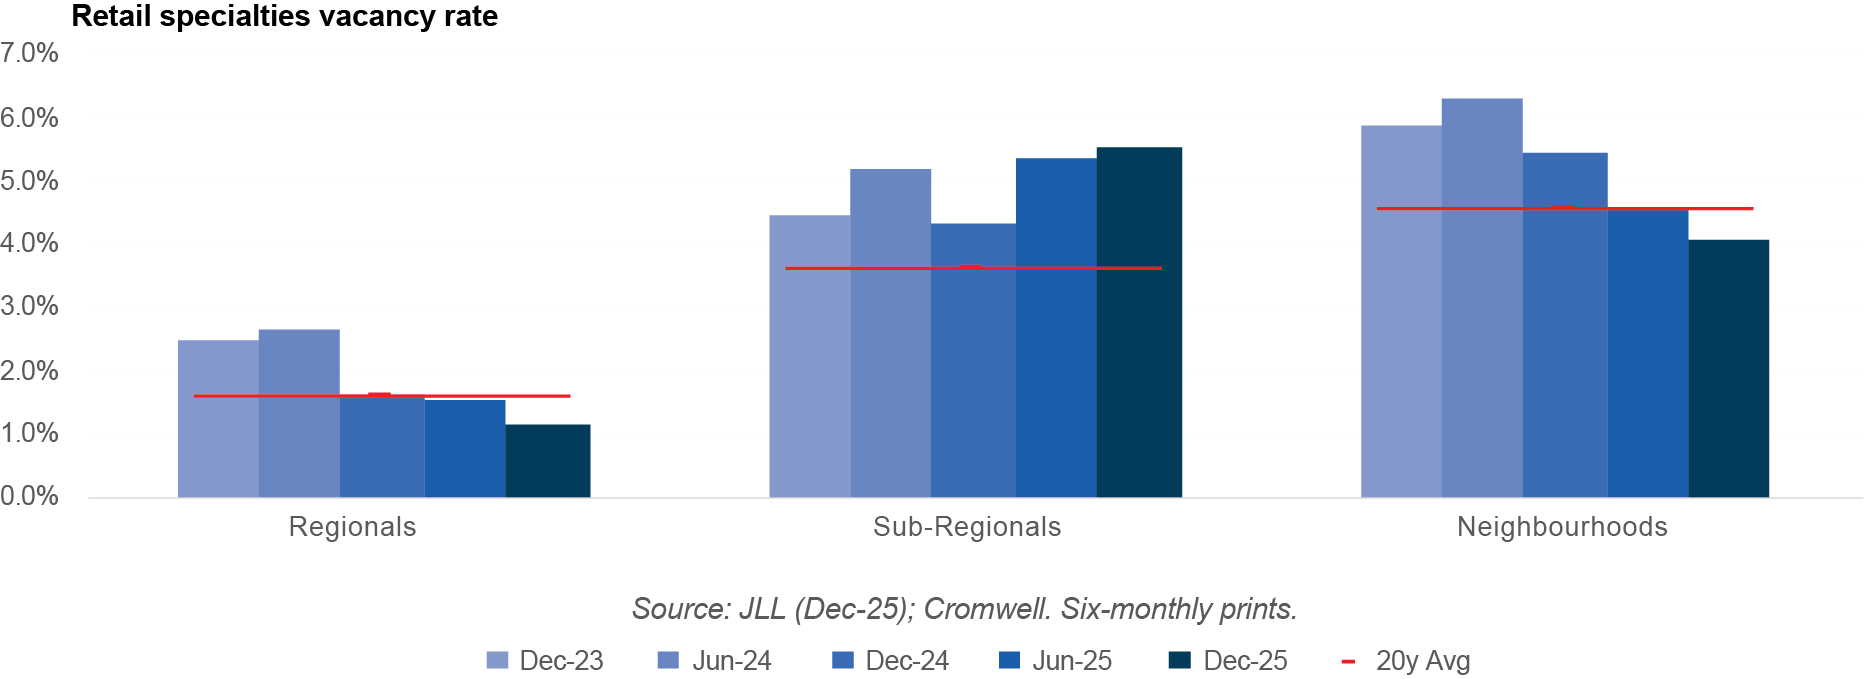
A positive demand environment combined with limited new supply led to improvement in retail vacancy rates. Neighbourhoods was the only centre type to record an increase in stock level over the quarter, as four new developments reached completion. Regionals vacancy declined to its lowest level in over ten years, with conditions improving the most along the East Coast. Neighbourhoods vacancy declined to its lowest level in nine years, led by South-East Queensland and Perth. It was a mixed bag for Sub-Regionals, with the vacancy rate over the last six months increasing in Melbourne by 120bps but decreasing in Perth by 190bps.
Net rents were relatively unchanged over the quarter. Sydney and Melbourne Regionals both recorded rising rents for the second consecutive quarter, albeit muted growth of just +0.2%. South-East Queensland remains the top-performing Regional shopping centre market on an annual basis despite being flat over the last three months. It was a similar story in Neighbourhoods, with Sydney recording quarterly growth of +0.2% and Melbourne net rents increasing by +0.3%. No markets recorded net rent growth for Sub-Regional centres.
Retail transaction volume strengthened over the quarter, totalling over $3.5 billion. Regional shopping centres dominated activity, comprising the three largest deals and nearly $1.9 billion of volume. Like last quarter, the largest deal was a 25% stake in the country’s second-largest shopping centre, Westfield Chermside in Brisbane. It was an active quarter for Sub-Regional and Large Format centres as well, with both centre types exceeding their average quarterly volume of the past five and ten years.
There were signs of retail yield compression across the quarter, consistent with stronger deal volume and investor interest. Regional average equivalent yields compressed by 12-13bps in Perth, Adelaide, and Melbourne. For Sub-Regionals, only the lowest (Sydney) and highest (Perth) yield markets were unchanged, with South-East Queensland, Adelaide, and Melbourne all recording compression of 12-19bps. It was a similar story in Neighbourhood centres with South-East Queensland, Melbourne, and Perth yields compressing 7-13bps.
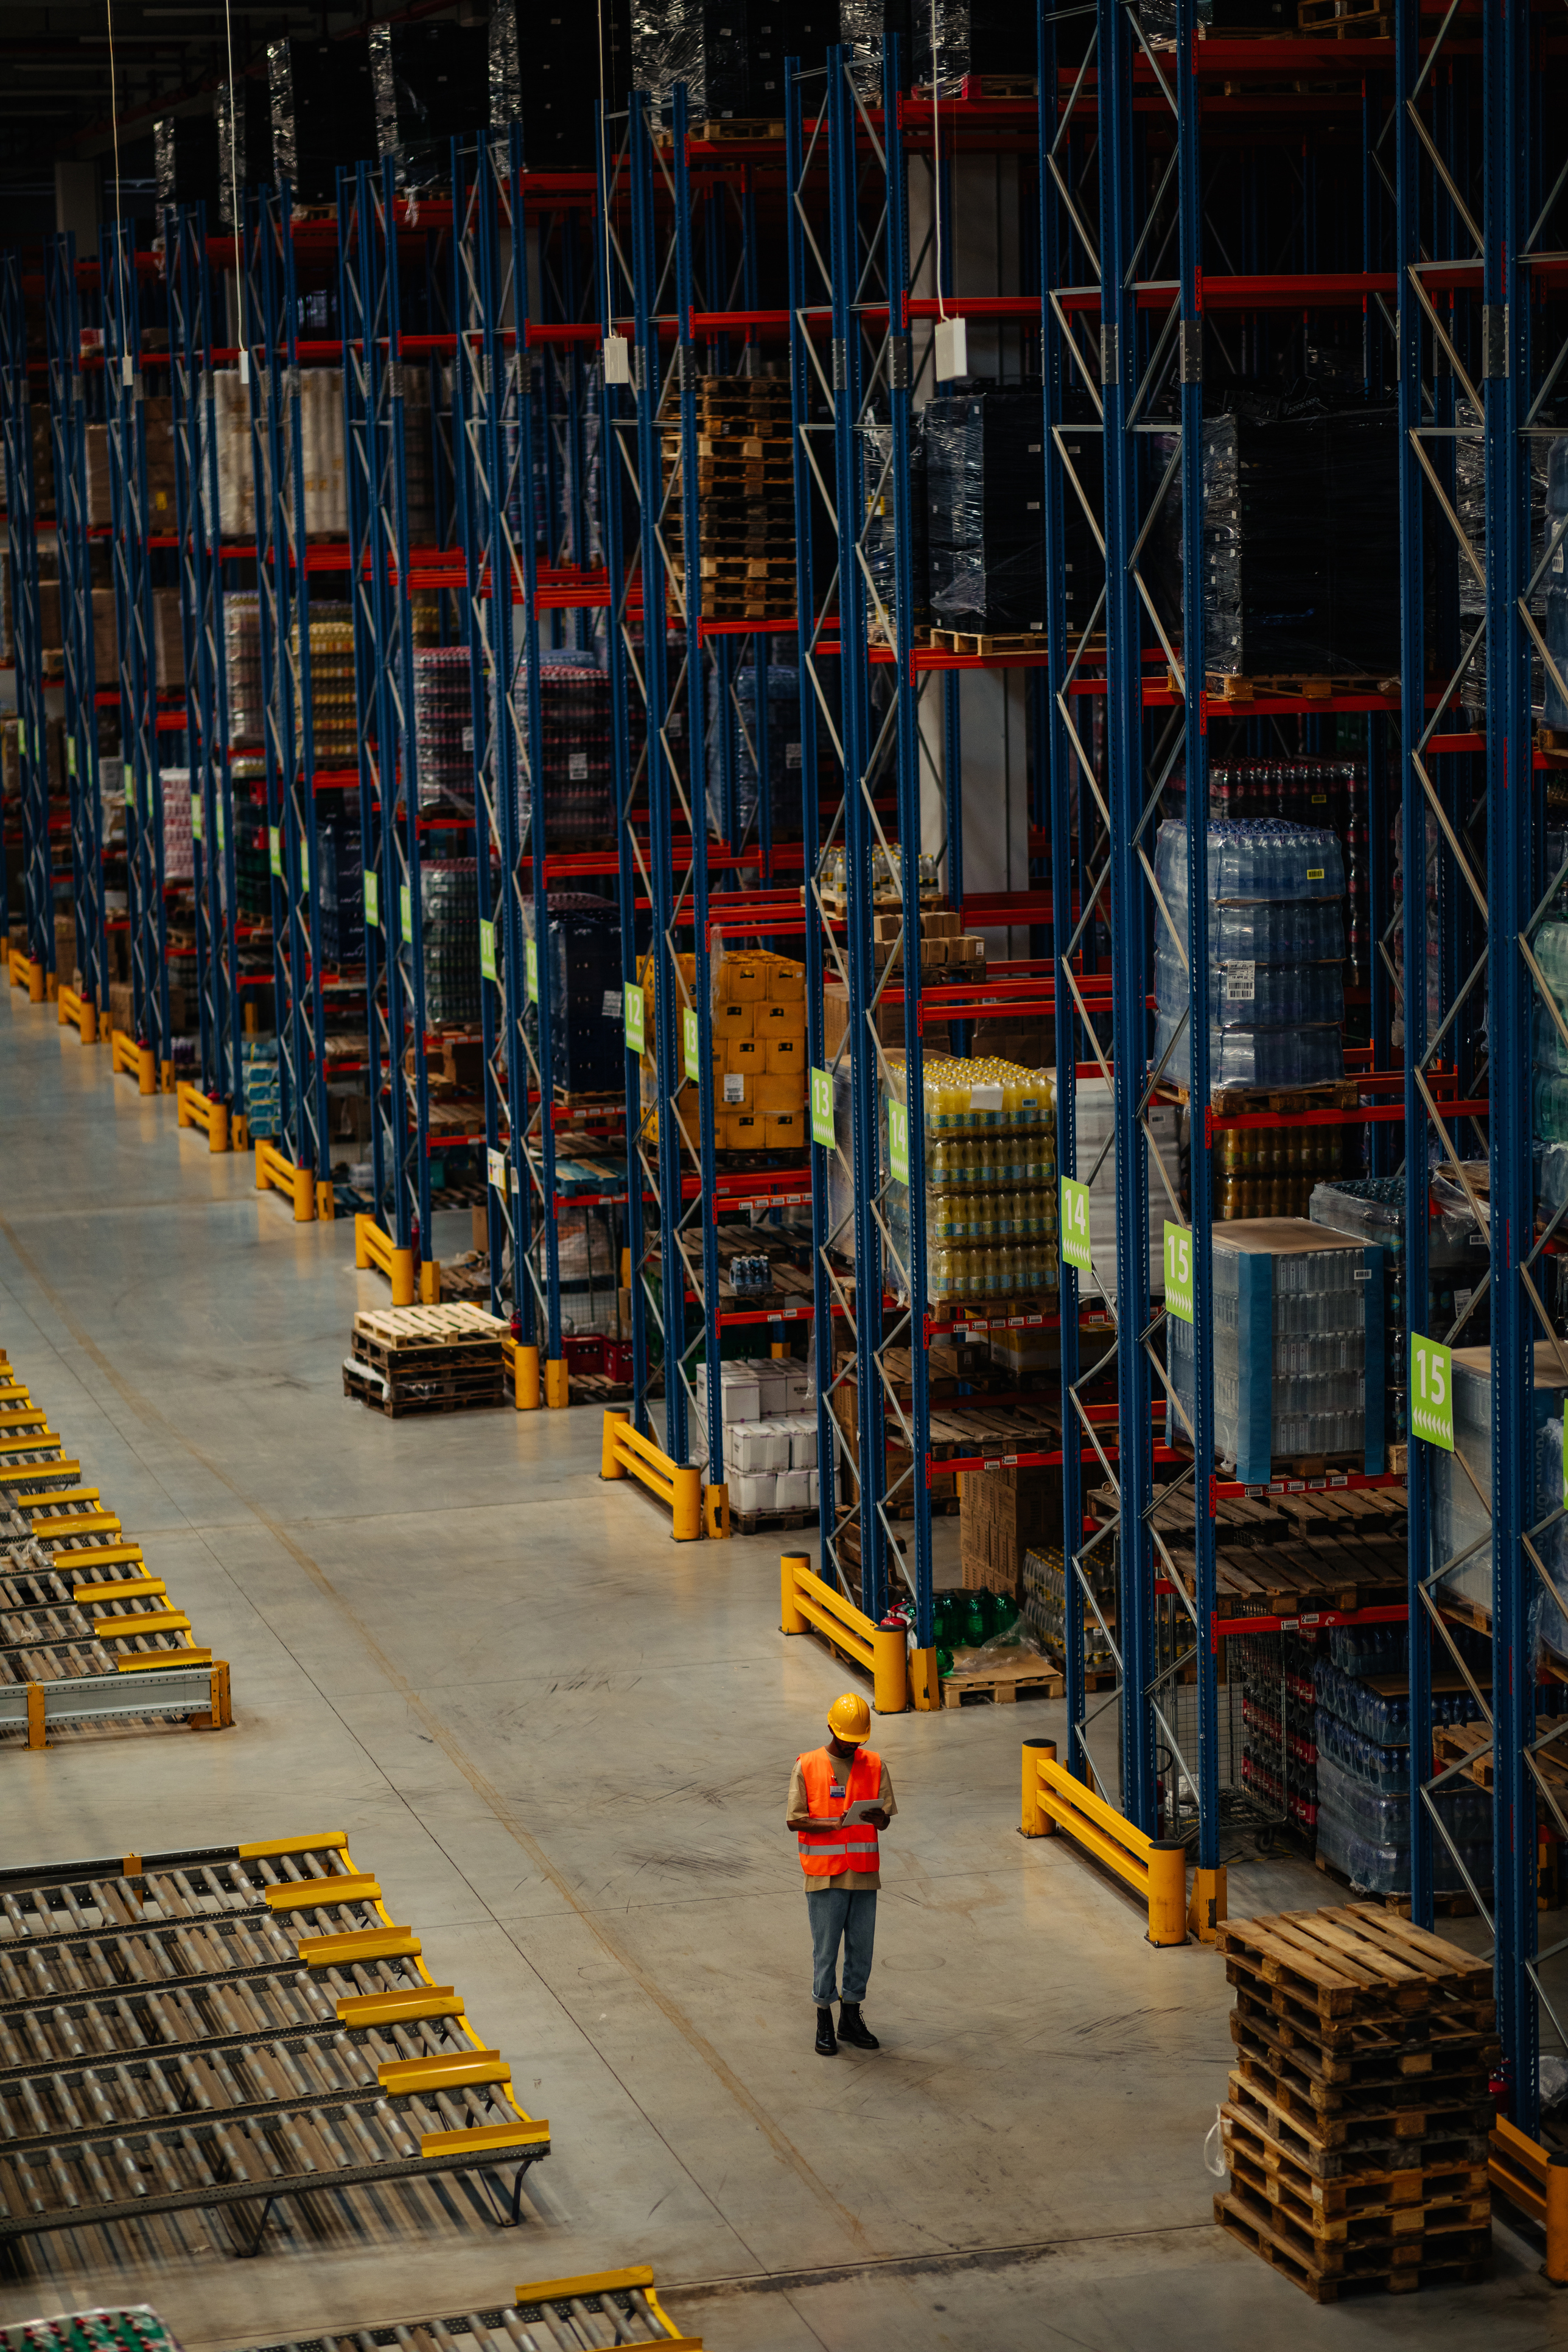
Occupier take-up (gross demand) softened compared to last quarter but remained well above the pre-COVID average. Retail & Wholesale Trade recorded the biggest decrease on a percentage basis, largely due to a slowdown in leasing activity from wholesalers. Manufacturing demand was resilient, exceeding 150,000 square metres, while smaller occupier industries such as Construction, Utilities, and Public Administration continued to record elevated demand relative to trend. From a geographical perspective, Melbourne recorded the most gross take-up at nearly 290,000 square metres. However, it was Perth that was the top-performer, recording its strongest quarter of demand since mid-2015. Perth’s strong outcome was driven by pre-leasing activity at new developments.
While demand is moderating, so too is supply. Just over 540,000 square metres of stock was added to the market in the final quarter, 11% less than the quarterly average over the last five years. Completions for 2025 totalled 2.3 million square metres, the lowest level of supply in a calendar year since 2021. There is currently 2.2 million square metres of supply under construction and due for completion in 2026, with a further 1 million square metres having plans approved or submitted and also scheduled for completion this year. A consistent trend over 2025 was the delay or postponement of projects due to construction and feasibility constraints, and this dynamic looks set to continue.
Prime net rent growth improved slightly on last quarter, averaging +1.0% nationally. Adelaide was the top-performing market as the majority of its precincts recorded rent growth of approximately +3.0% for the quarter. Rent growth was solid in Brisbane but largely flat across Sydney, Melbourne and Perth. Across the East Coast, market rent growth continues to normalise as vacancy rates move back towards long-term averages. Average prime incentives decreased by 250bps in every Perth precinct and were largely unchanged across the other markets, supporting effective rents.
Industrial transaction volume was weak in the final quarter of 2025, driven by a lack of large portfolio deals and limited transaction activity in the two largest markets (Sydney and Melbourne). For the first time in five years, Brisbane was the highest volume market in dollar terms, underpinned by the Southern precinct.
Average prime yields compressed by 12bps across most precincts in Sydney, which maintained its position as Australia’s tightest market. Most Adelaide precincts also recorded compression, ranging from 13-25bps. At the other end of the spectrum, Melbourne yields expanded by 25bps in each of its three major precincts. Anecdotally, confidence and pricing have been impacted by an uncertain policy environment.
Outlook
While the S&P500 has risen to record highs, trade policy uncertainty remains a headwind for stronger investor confidence. The Supreme Court is set to rule imminently on the legality of Trump imposing tariffs using IEEPA powers. Jobs growth and company earnings could benefit from the removal of the tariffs. However, the administration has indicated that other legislative instruments (such as the 1962 Trade Act) will be used to maintain the status quo if the current arrangement is struck down. Geopolitics more broadly will be closely watched, as the implications of the Venezuela operation become clearer. Trump also appears to be laying the groundwork for Greenland negotiations, which could result in the US gaining greater access to the territory’s natural resources (e.g. rare earth minerals). Meanwhile, protests have intensified in Iran, adding another layer of geopolitical risk for markets.
While Australia is not immune from global ructions, it is relatively insulated. The RBA has delivered a “soft landing” to date, but inflation remains elevated and needs to be addressed before expectations become unanchored from the 2-3% target range. This can be achieved with tweaks to monetary policy – rather than wholesale changes – as economic data evolves.
The commercial property market continues to stabilise, with improving sentiment evident in both capital flows and leasing fundamentals. Construction remains prohibitively expensive in most circumstances, crimping development pipelines and supporting the valuation and rent growth outlook for existing assets. Office appears to have reached an inflection point, with valuations improving and institutional and offshore capital becoming more acquisitive, particularly for prime assets. A similar, more progressed story is playing out in retail, as shopping centres at either end of the leisure-convenience spectrum record tightening yields. We see industrial performance becoming more precinct-specific, as greater variance in space market fundamentals emerges across markets and asset types.
Sign up to Insight Magazine
Stay informed about investing strategies, finance news, property market updates, and more by signing up for Insight. Build a solid foundation of investment knowledge to help you make the right investment decisions and guide you in planning your investment journey.
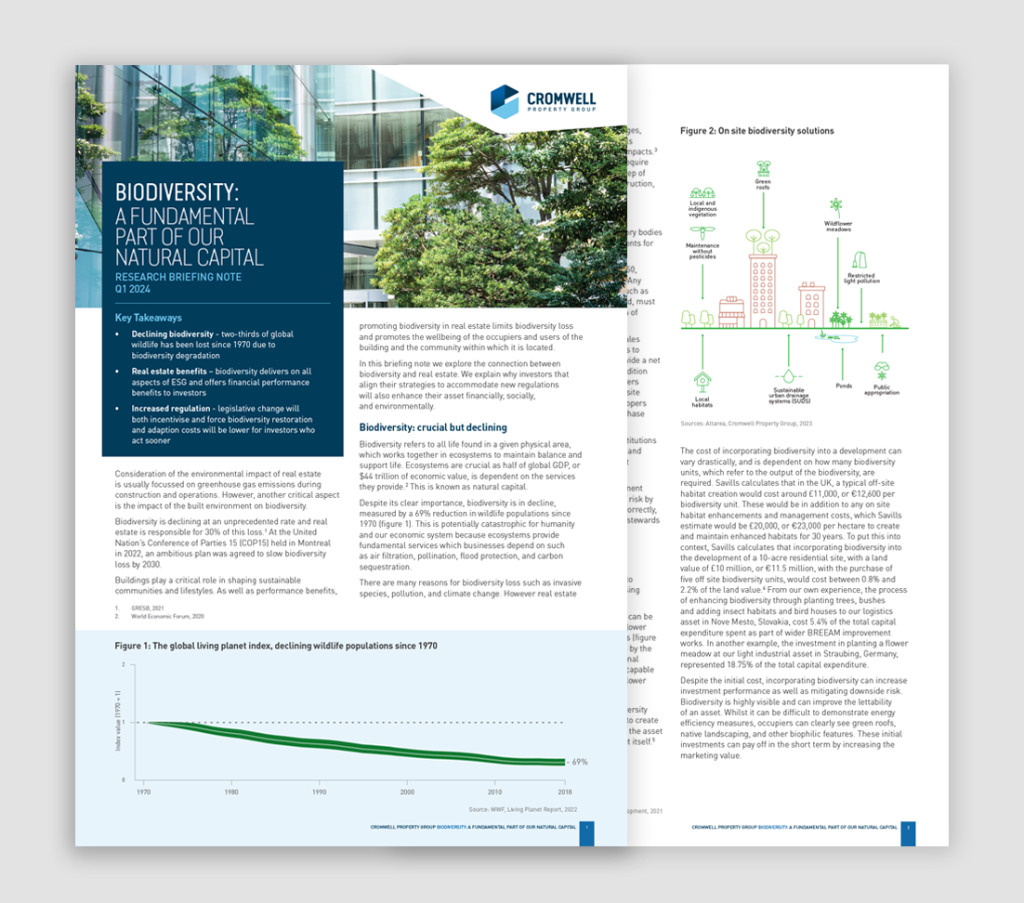
Biodiversity: a fundamental part of our natural capital
Consideration of the environmental impact of real estate is usually focussed on greenhouse gas emissions during construction and operations. However, …