Footnotes
Important Notice
This correspondence has been prepared by Cromwell Funds Management Limited ABN 63 114 782 777 AFSL 333214 (CFM), Cromwell Real Estate Partners Limited ABN 23 152 674 792 AFSL 418476 (CREP) and Cromwell Property Securities Limited ABN 11 079 147 809 AFSL 238052 (CPSL), all of which are wholly owned subsidiaries of Cromwell Corporation Limited ABN 44 001 056 980. Cromwell Property Group comprises Cromwell Corporation Limited ABN 44 001 056 980 and Cromwell Diversified Property Trust ARSN 102 982 598, the responsible entity of which is CPSL.
This correspondence is not intended to provide investment or financial advice or to act as any sort of offer or disclosure document. It has been prepared without taking into account any investor’s objectives, financial situation or needs. It is provided for general information purposes only. Any potential investor should make their own independent enquiries, and talk to their professional advisers, before making investment decisions. In making an investment decision in relation to any fund, it is important that you read the disclosure documents issued by that fund. The disclosure documents for the funds are available from www.cromwell.com.au or by calling Cromwell’s Investor Services Team on 1300 268 078.
None of CFM, CREP, CPSL or its related bodies corporate or their respective officers, employees, agents or advisors (Cromwell Property Group Members) make any representation or warranty, express or implied, as to the accuracy, completeness, timeliness or reliability of the contents of this webpage. To the maximum extent permitted by law, none of the Cromwell Property Group Members accept any liability (including, without limitation, any liability arising from fault or negligence) for any loss, damage, cost or expense whatsoever arising from the reliance on or use of this webpage or its contents or otherwise arising in connection with it.
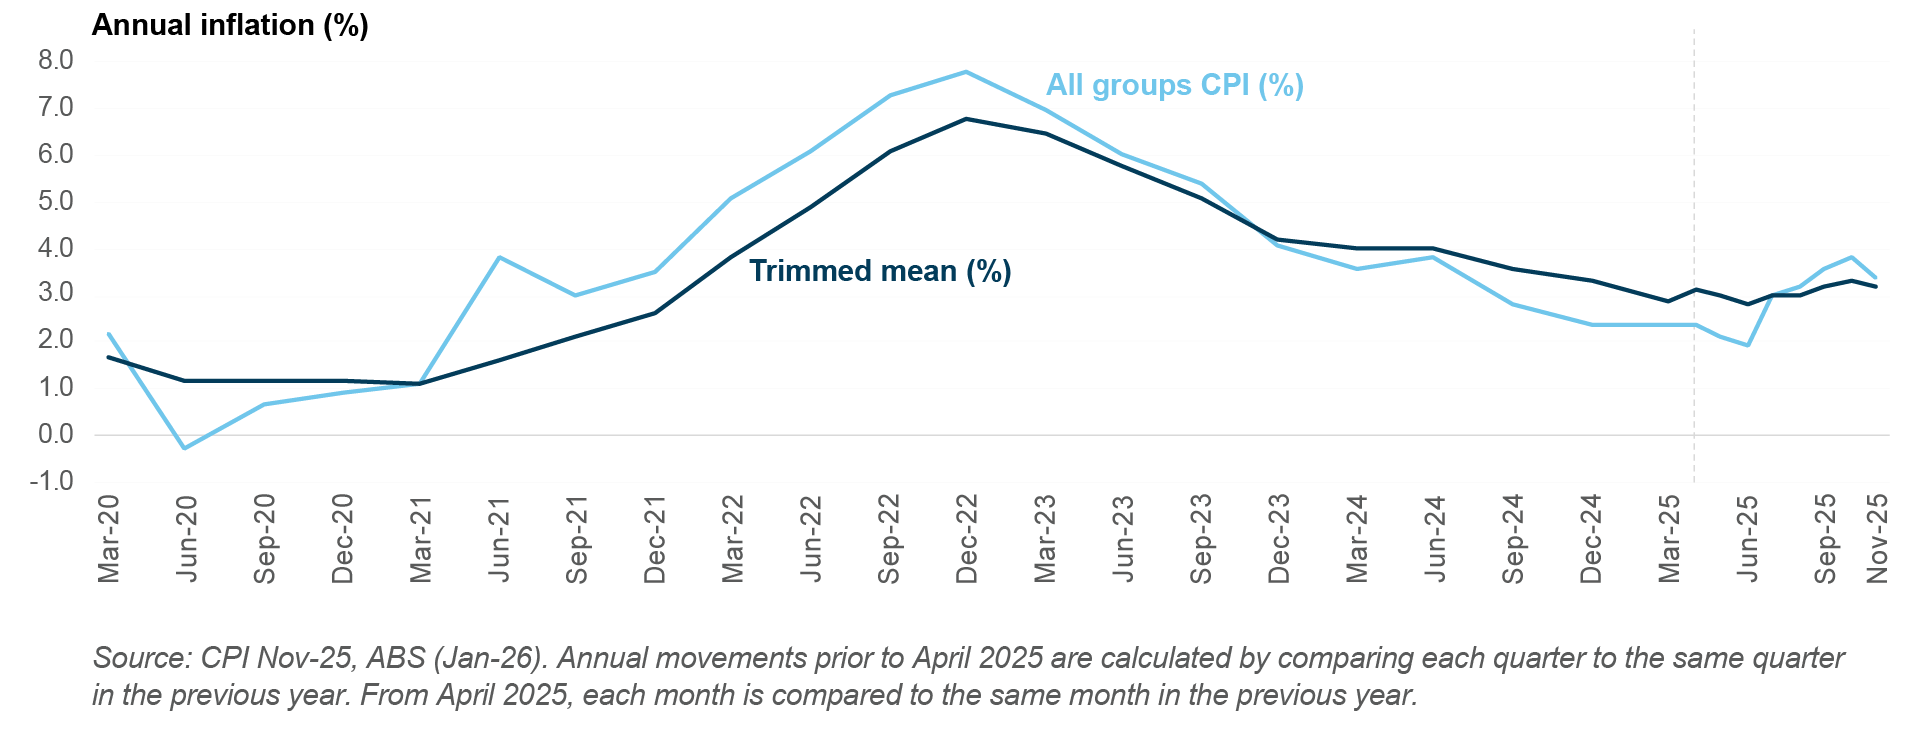
This webpage may contain forward-looking statements, guidance, forecasts, estimates, prospects, intentions, projections or statements in relation to future matters (Forward Statements). Forward Statements can generally be identified by the use of forward looking words such as anticipate, estimates, will, should, could, may, expects, plans, forecast, target or similar expressions. Forward Statements including indications, guidance or outlook on future revenues, distributions or financial position and performance or return or growth in underlying investments are provided as a general guide only and should not be relied upon as an indication or guarantee of future performance. Forward Statements are subject to known and unknown risks, uncertainties, contingencies and other factors which may cause actual results, performance or achievements to differ materially from those expressed or implied by the Forward Statements. No independent third party has reviewed the reasonableness of any such statements or assumptions. None of the Cromwell Property Group Members represent or warrant, assure or guarantee that such Forward Statements will be achieved or will prove to be correct or gives any warranty, express or implied, as to the accuracy, completeness, likelihood of achievement or reasonableness of any Forward Statement contained in this webpage. Cromwell Property Group Members assume no obligation to release updates or revisions to Forward Statements made as of the date of this webpage to reflect any changes that occur after the date of this webpage. Past performance is not a guarantee of future performance.
The distribution and use of this webpage, including any related advertisement or other offering material, in jurisdictions outside of Australia may be restricted by law and any person who resides outside Australia or who receives this webpage outside of Australia should seek advice about it and observe any applicable legal restrictions.
CFM, CREP and CPSL do not receive any fees for the general advice given in this correspondence.


 1) Negative gearing changes (residential focus)
 The Budget doesn’t rewrite the investment case for commercial property, but it may be considered by market participants to improve


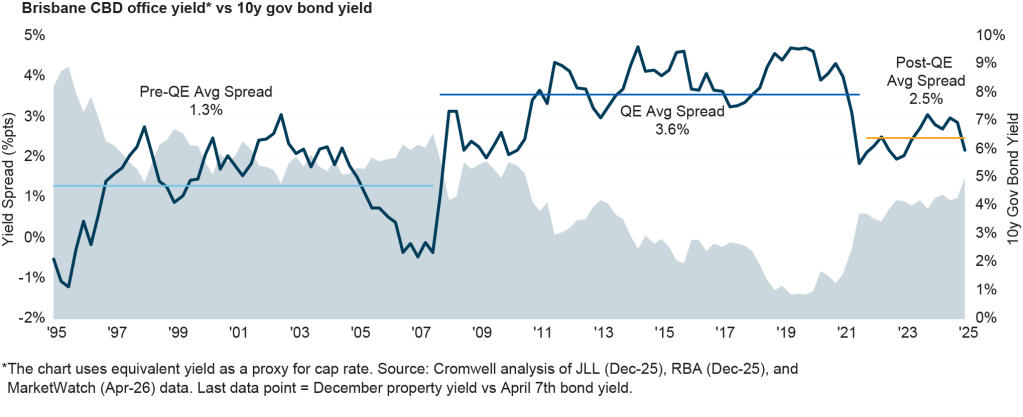

 Liquidity: how markets actually reprice