37206
Person typing on a laptop

Learn

Home Tracking the office recovery – five charts that tell the story
November 27, 2025

Tracking the office recovery – five charts that tell the story

Colin Mackay, Research & Investment Strategy Manager, Cromwell Property Group


After a 19-year premiership drought, the Broncos have returned to the top of the rugby league totem pole. Another redemption story, not as long in the making, is underway in commercial real estate. Office was out of favour through the pandemic, weighed down by rising interest rates, subdued liquidity, and concerns that remote work would irreparably damage demand for space. Now, conditions are improving and sentiment is becoming more positive – and the proof is in the total return pudding. Below are five charts that highlight the recovery occurring in the office sector.

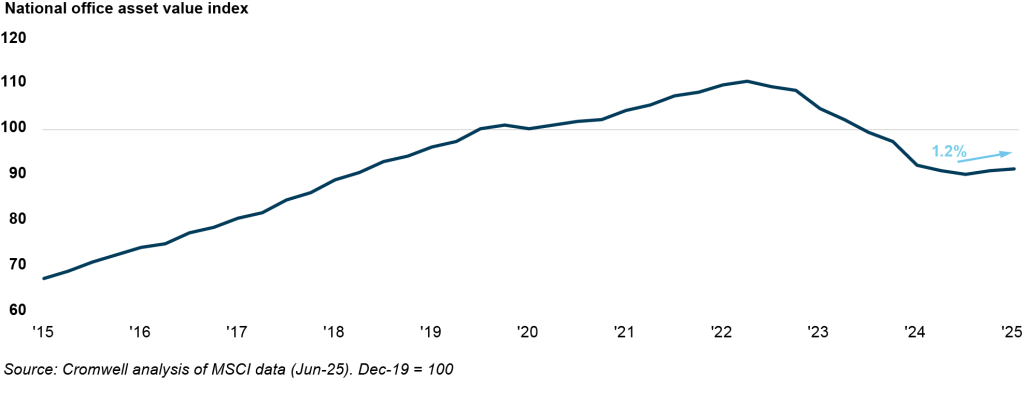
1. Asset prices appear to have bottomed

Office asset values across Australia fell -18% from late 2022 to the end of 2024. The devaluation cycle appears to have concluded, with appreciation of +1.2% recorded over the first half of 20251 . The downturn has created a compelling entry point for investors – office is currently providing a larger yield premium over the Australian 10-year Government Bond compared to the 30-year average.

The downturn has created a compelling entry point for investors – office is currently providing a larger yield premium over the Australian 10-year Government Bond compared to the 30-year average.

2. Investment performance is improving

Stable yields and ongoing income growth have contributed to an improvement in total return. Performance has been positive for the last two quarters, leading to the strongest rolling annual total return since early 2023.

3. Tenant demand now exceeds pre-pandemic levels

The income growth side of the ledger has been driven by strengthening tenant demand. Remote work did have a significant impact on occupied space in 2020, however demand has been increasing for nearly five years now. The recovery is even more impressive when split by asset quality – prime grade assets have recorded demand growth of +11% over the last five years, while demand for space in secondary assets contracted by -9%.

4. Rents are growing in most markets

Stronger tenant demand has flowed through to rents. Over the last five years, rents have increased in every major CBD market except Melbourne. Consequently, annual national CBD rent growth has been outpacing inflation since September 2024. Additionally, prime incentives are significantly higher than the long-term average in every major market, suggesting there is scope for them to fall if leasing conditions remain favourable. Decreasing incentives would provide a tailwind for income growth.

5. Future supply risk is lower than average

Construction is prohibitively expensive and new developments are very rarely “stacking up” in the current environment. With few projects breaking ground, the supply of CBD office space is expected to increase by only +0.3% p.a. to 2030, well below the long-term average annual rate of +1.1% and significantly lagging white collar jobs growth. A constrained supply pipeline should put downwards pressure on vacancy rates, supporting the sustainability of the recovery and the outlook for rent growth.

Heading in the right direction

While the turnaround of a real estate sector doesn’t happen overnight, multiple metrics show office is improving. For some, fear of catching a falling knife is turning into fear of missing out on the recovery upswing. With dual levers of stronger demand and weaker supply boding well for a tightening of vacancy and continued rent growth, office has every chance of topping the investment return table over the coming year.


  1. Cromwell analysis of MSCI data (Jun-25)