Stock in Focus – APAC Resources
Jordan Lipson, Portfolio Manager, Cromwell Phoenix Global Opportunities Fund

Gold Exposed Stocks – An Update
In the performance commentary section of the September 2025 quarterly report, we discussed the portfolio’s exposure to gold miners and gold-exposed securities, a theme that had grown into a meaningful part of the portfolio. Given the eventful period that has followed, an update is warranted.
As a reminder, the Fund seeks out securities trading at discounts to readily assessable net asset values (NAVs), or special situations offering strong risk-adjusted returns. Gold miners are unusually well suited to this approach. Unlike most businesses, the value of a gold miner’s primary output can be observed directly, in a deep and liquid spot and futures market, which makes its NAV genuinely assessable. Towards the end of 2024, the share prices of many gold miners were simply not reacting to a rising gold price. A clear gap opened up between the value of the underlying assets and the prices being asked for them, and we saw an opportunity.
Our exposure
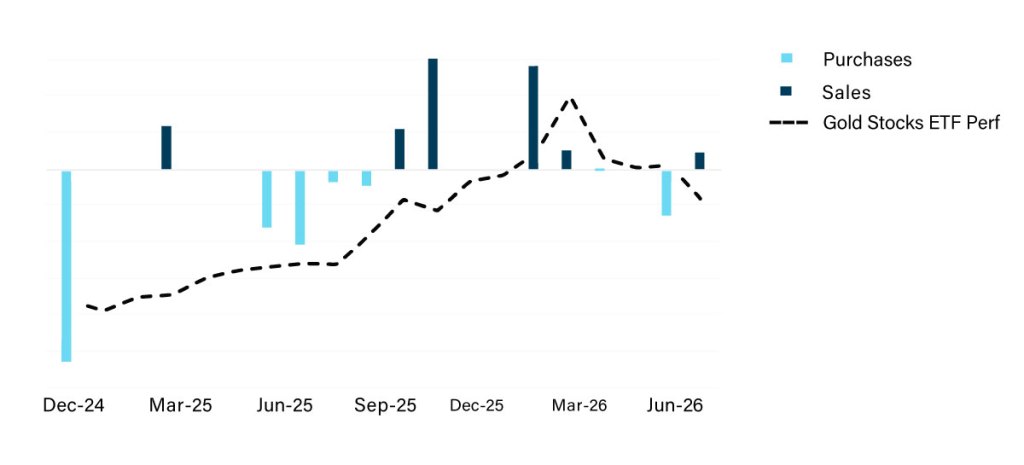
We established a meaningful exposure in November 2024, to a basket of particularly attractively priced stocks. As the gold price climbed, we generally topped up. This may seem counterintuitive, buying more as the commodity became more expensive, but it followed directly from the leverage described previously. A higher gold price lifted the NAVs of these miners faster than the metal itself, while their share prices continued to lag. In many cases the discount to NAV widened rather than narrowed, and we added accordingly.
As those discounts eventually began to close, and as the gold price reached levels that we found somewhat uncomfortably high, we started to slowly decrease our exposure to the sector. With the benefit of hindsight, these sales were both too early and not significant enough.
Recent performance
Amid a volatile macroeconomic and geopolitical environment, the gold price retreated from its highs over the period. It fell approximately 12% during the quarter and now sits around 25% below its January 2026 peak. After a long period in which the gold price moved rapidly higher, the direction of travel reversed.
In this environment, gold stocks detracted from performance. It is worth keeping this in perspective. Despite the weakness of the period, these securities have been significant contributors to returns over the life of the Fund. Over the quarter, ASA Ltd (NYSE:ASA) was down 16.4%, Oceana Gold (TSX:OGC) fell 20.6% and Alkane Resources (TSX:ALK) was more resilient, off 3.0%. One holding, however, disappointed for reasons that went well beyond simple weakness in the sector.


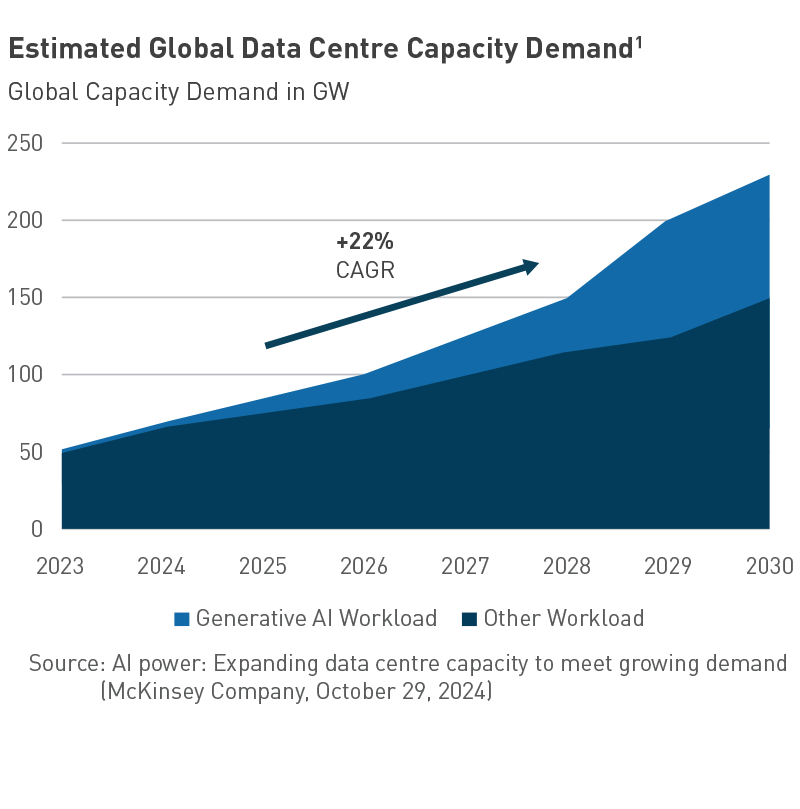
 HPS has unequivocally delivered great results in recent times, with growth driven by demand from data centres as well as other industrial applications. HPS also has a highly professional investor relations function, with detailed quarterly results presentations, slick ESG reporting and analyst coverage by major Canadian investment banks. HPS has been rewarded with a fair valuation. It has a market cap above $1.5 billion1 and trades on a price to earnings ratio above 17x. While HMM’s business hasn’t quite kept pace with HPS’s eye watering growth, over the past seven years it has grown revenues at approximately 10%


 Listed property has long been a staple for investors seeking sustainable income and exposure to commercial real estate. Yet, in recent times, some asset consultants and researchers have shifted allocations toward global real estate investment trusts (GREITs), citing concerns about concentration risk in the Australian market. To explore why listed property still deserves a place in a well-diversified portfolio, we sat down with Stuart Cartledge, Managing Director of Phoenix Portfolios, to discuss the opportunities in listed property, diversification strategies, and how Phoenix approaches the market.