August 3, 2023
June 2023 direct property market update
Peta Tilse

Peta Tilse
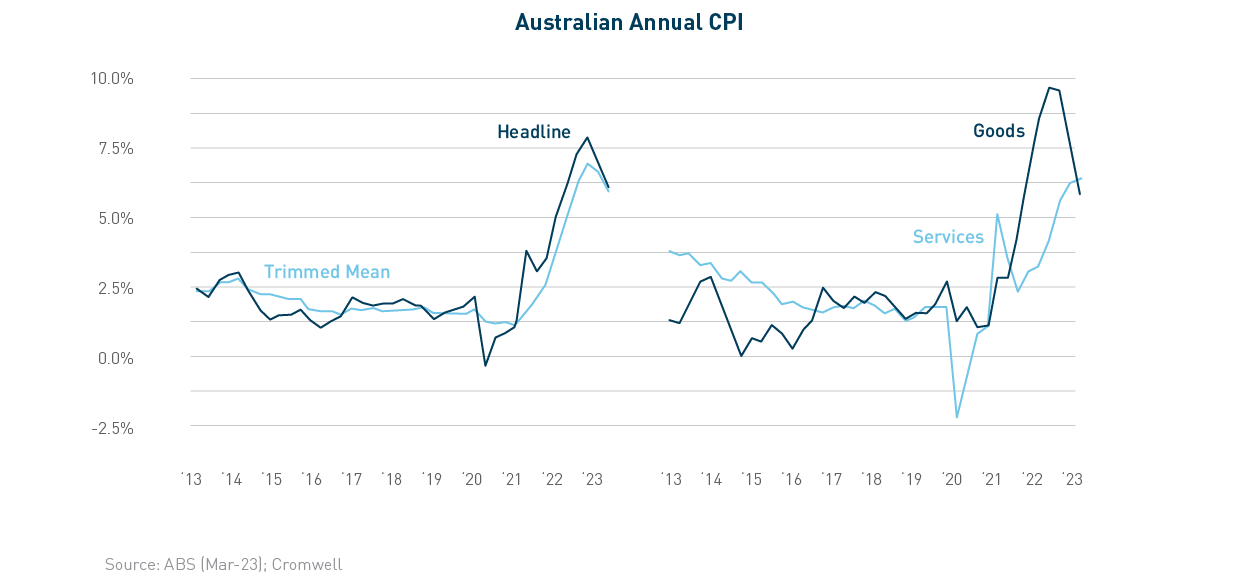
At the risk of sounding like a broken record, the outlook for inflation and interest rates was again the key focus for markets over the June quarter. It does appear that central banks are winning the fight against inflation, with CPI prints in the US and Australia coming in below market expectations and Canadian inflation dropping below 3%.
Australia’s June quarter data showed goods inflation continues to slow, with services inflation stickier (as expected). Annual inflation is now sitting at 6.0%, down from 7.0% in the previous quarter. Surging insurance premiums (14.2%), elevated food prices, and the highest annual rent inflation since 2009 were the key drivers.
The softer-than-expected inflation print provided the RBA with breathing room, with markets now expecting a pause at the August meeting. At this late stage of the cycle, it’s prudent that rates are only hiked when compelled by the data, and most indicators such as hiring plans, consumption, and confidence point to slowing ahead.
The strong labour market will potentially force another rate hike in coming months if it remains tight, but it’s important to remember that unemployment is a lagging indicator. The RBA is conscious of our highly indebted household sector; the high proportion of fixed rate mortgages which will be rolling onto higher variable rates; the 400bps of tightening which is still yet to fully hit the economy; and rising rents putting pressure on household budgets.
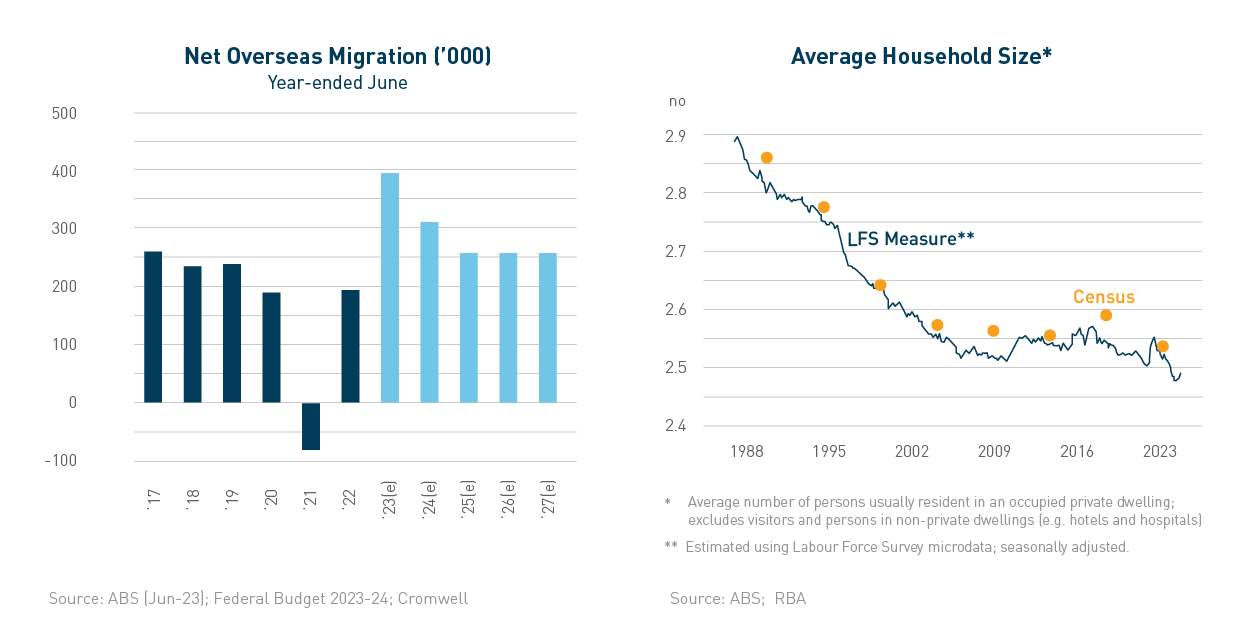
The challenge of rising rents is in part due to a mammoth increase in population, driven by estimated net overseas migration of 400,000 people for the year to June1. While the very strong population growth will expand the demand base of the economy, it does place extra strain on a housing sector which was already behind the pace in supplying adequate dwellings. There isn’t a quick fix, so residential rents will likely continue rising at a solid pace for some time. There is a limit to how much rental growth households can stomach, and relief will likely be seen via an increase in the average household size. After decreasing to record lows over the year, a reversion of household size to the pre-COVID average (~2.52 people) would “free up” around 100,000 dwellings, while an increase to 2.55 would account for all estimated population growth in the year to June.
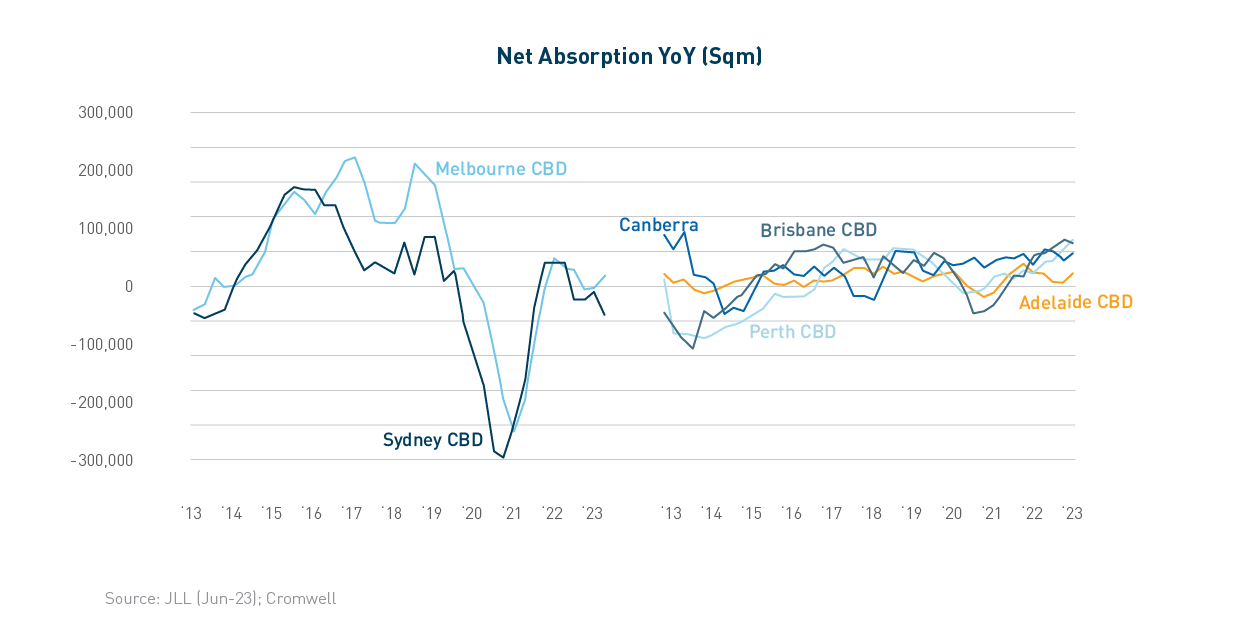
It was a mixed bag for office data over the latest quarter, as rental growth proved resilient despite early signs of softening across space fundamentals and yields. According to JLL Research, national CBD net absorption totalled over 13,000 sqm, with four of six markets recording positive demand. The resource-based markets of Brisbane and Perth comfortably saw the strongest levels of demand, with expansion from the public sector, mining and professional services driving their positive results.
Sydney CBD recorded the weakest result, as large occupiers across financial services and technology contracted their footprint and/or offered excess space for sublease. Prime stock continued to record stronger net absorption than Secondary stock on a national basis.
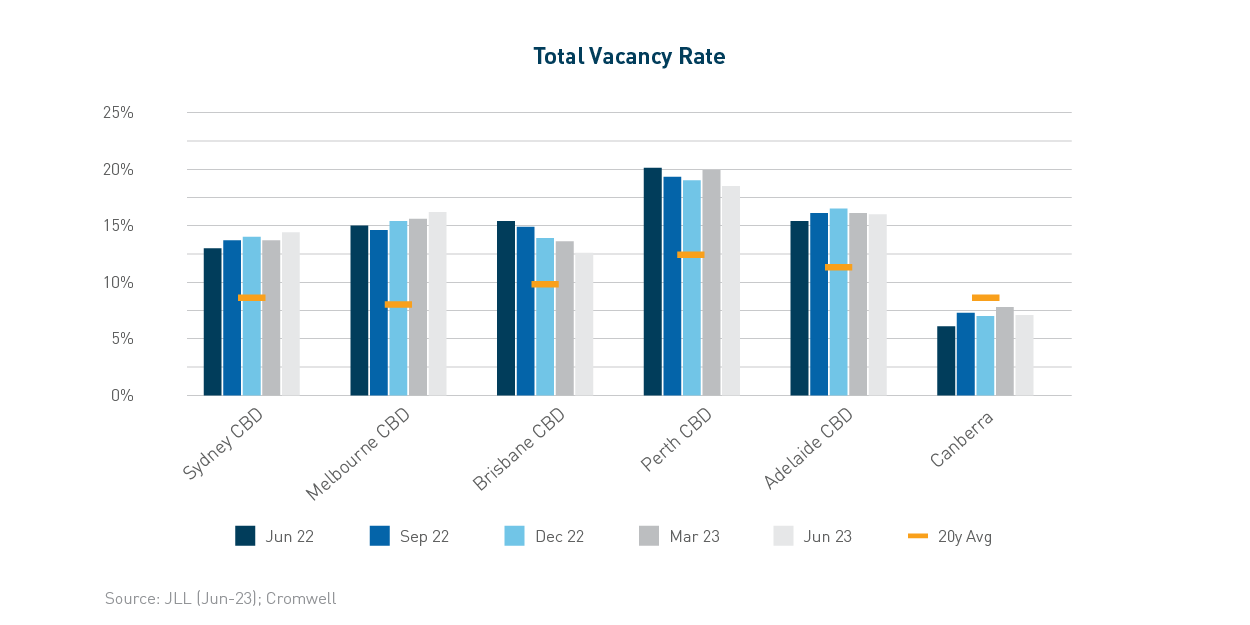
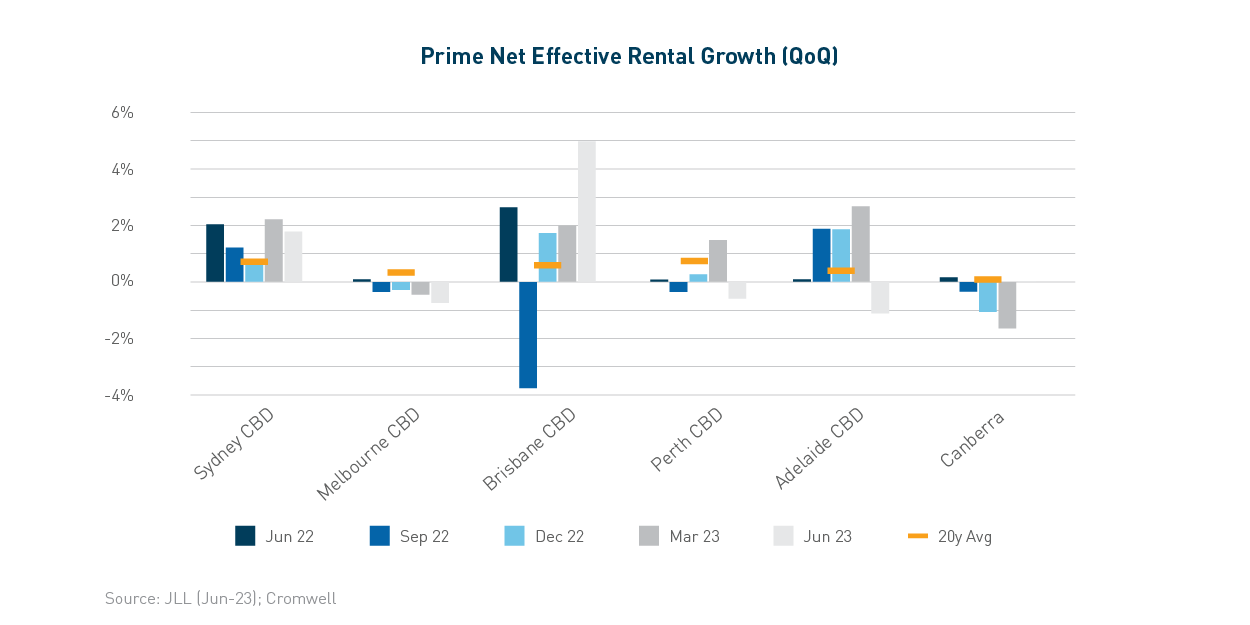
The national CBD vacancy rate increased negligibly to 14.4%. Reflecting the large occupier trends noted above, Sydney and Melbourne both saw an increase in the vacancy rate. The other CBD markets recorded a lower vacancy rate compared to the first quarter of the year, with Brisbane and Perth seeing the most tightening consistent with their stronger net absorption outcomes. Despite elevated vacancy, rental growth was broadly positive. Prime net face rents grew across every CBD market for the quarter, led by Brisbane. Prime incentives were largely stable, leading to positive net effective rental growth across half the markets and the strongest growth in four quarters on a national basis.
The impact of higher interest rates was reflected in a softening of Prime yields over the quarter, resulting in lower valuations across the sector despite supportive income growth. Transaction volume remains very low, with 44 Market St, Sydney the only notable Prime asset which traded over the quarter.
The impact of higher interest rates is starting to be felt by consumers, with retail sales declining -0.8% in June. This was the fifth consecutive month of sub-1% growth, bringing annual growth down to 2.3%. Growth was weakest across the discretionary categories of Department Stores and Clothing, as their very strong run through the pandemic starts to lose steam. Groceries was the top performing category over the month with its more resilient inflation drivers, while eating out held up relatively well considering the headwinds facing consumers.
Positively for retail real estate, income growth continues to recover from COVID impacts. Retail sales are still 16% above the level implied by the pre-COVID trend, and leasing activity reflects the outperformance which accrued to tenants over the period. Retail has not been immune from the expansion of yields seen across real estate in the June quarter. However, retail’s higher starting yield means the movement is less impactful to valuations on a percentage basis.
While income recovery is strongest across discretionary-focused assets, investors continue to prefer centres underpinned by a strong convenience offering. A 50% stake in Westfield Tea Tree Plaza came to market this month and will provide pricing evidence for large shopping centres.
Industrial continues to generate significant face and effective rental growth, albeit at a slowing pace. The strength of the sector is due to its favourable demand-supply balance, with national vacancy remaining below 1%2 . Space take-up continues to be led by Transport & Warehousing, Retail Trade, and Manufacturing occupiers. Pre-leased space, particularly in Brisbane, continues to be the main driver of take-up, however this is skewed by the lack of lettable space – Sydney vacancy is near zero and impacting the ability of occupiers to move or expand.
Supply is expected to reach record levels in 2023, with high levels of completions also expected in 2024. Vacancy is still expected to remain well below long-run averages despite elevated development, with most of the pipeline for 2023 already pre-committed. There is also a risk that some of this supply is delayed in coming to market, particularly in Sydney, due to labour shortages and planning delays.
The Australian economy remains in a solid position despite global headwinds. Inflation is slowing, employment is solid and population growth will provide support to demand over the course of the year. The rate hiking cycle is nearing its end, financial stability has been maintained, and distress remains contained.
These factors put the Australian commercial property market in good stead from a demand perspective. Businesses continue to adjust size requirements for occupancy as they live with hybrid working, although in certain markets this is now largely known. Experiential workplaces with clever refurbishments and amenity continue to attract and retain quality tenants; something we continue to see within our assets. Capital continues to view Australia as a favourable investment destination given its attractive demographic profile, growth prospects, and relative social and political stability.
Powerful megatrends such as the need for more sustainable, energy efficient real estate, demographic shifts, and rising demand for segments serving the modern economy such as urban logistics, healthcare and highly amenitised offices will create income growth opportunities.
The Cromwell Direct Property Fund (CDPF) was fully revalued this quarter by external valuers with 54% of the portfolio completed as at 30 April 2023, and the remainder as at 30 June 2023. The portfolio of assets as at 30 June reflects best available information. Despite good leasing outcomes, valuations were impacted by some recent sales which saw a further widening in cap rates of between 0.125% to 0.75% (depending on the individual asset fundamentals).
After the quarter’s end (7 July), Cromwell Funds Management Limited (CFM), as the responsible entity of the CDPF, entered into a Merger Implementation Deed (MID) with Australian Unity Property Limited (AUPL). If successful, the trust scheme under the MID will see the Australian Unity Diversified Property Fund merge with CDPF creating a 15 asset portfolio across the Industrial, Retail Convenience, and Office sectors, and increasing location diversification with three assets located in Western Australia.
View further information about the proposed merger here: Cromwell Direct Property Fund Proposed Merger – Cromwell Funds Management
The Fund continues to distribute 6.75 cents per unit p.a., or 6% p.a3 (payable monthly), and has generated annualised total returns since inception of 7.2% p.a. The Cromwell Direct Property Fund continues to demonstrate excellent risk adjusted returns for investor portfolios.
Performance (%) p.a as at 30 June 2023
| Year | Cash (AU) | Bonds (AU) | Shares (AU) | Cromwell Direct Property Fund |
| 1 | 2.89% | 1.24% | 14.4% | -11.0% |
| 3 | 1.01% | -3.51% | 11.07% | 2.70% |
| 5 | 1.17% | 0.51% | 7.12% | 3.60% |
Past performance is not a reliable indicator of future performance. Source: Lonsec and Cromwell Funds Management
1. 2023-24 Federal Budget estimate
2. CBRE Research, Australia Industrial and Logistics Figures Q2 2023
3. Based on current distributions of 6.75 cents per unit p.a. and a current unit price of $1.1156 as at 30 June 2023.
Read more about Cromwell Direct Property Fund, including where to locate the product disclosure statement (PDS) and target market determination (TMD). Investors should consider the PDS in deciding whether to acquire, or to continue to hold units in the Fund.