January 23, 2024
December 2023 direct property market update
Peta Tilse, Head of Retail Funds Management

Peta Tilse, Head of Retail Funds Management
Over the December quarter, interest rates were reasonably volatile both in terms of short and longer-term rates. The RBA increased interest rates by 25 basis points (bps) in November, taking the cash rate to 4.35%; its highest level since the end of 2011. The justification for the move was to bring inflation to target within a reasonable timeframe (i.e. by end-2025), rather than risk a prolonged overshoot and upwards shift to inflation expectations.
Subsequently, softer than expected inflation offshore and in Australia, together with dovish comments from central banks, helped take some of the heat out of bond yields through to December. Australian government 10-year bond yields decreased by 52bps over the quarter to 4.0%.
More recent data has shown Australia’s annual inflation pace slowing quite materially from 4.9% in October to 4.3% in November1. While there could be an uptick in Q1 2024 due to base effects and government subsidies rolling off, there was little in the latest data which would give the RBA cause for concern. Goods inflation continued to slow, and services inflation appears to have peaked. While dwelling and rental costs and insurance premiums rose further, dining out and household services eased. Overall, inflation is on track to undershoot the RBA’s forecast for the quarter, decreasing the likelihood of a hike in February.
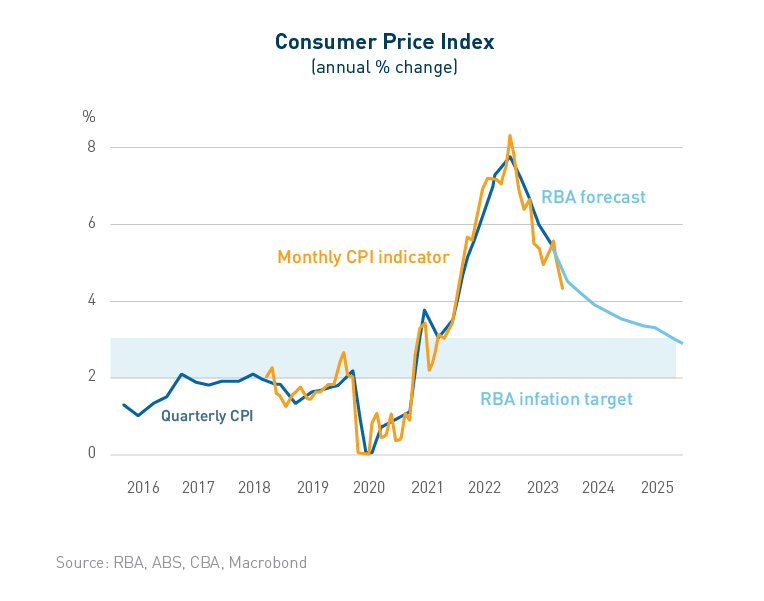
While expectations of further cash rate hikes have diminished, 10-year bond yields remain approximately 40bps higher than a year ago2, putting pressure on debt costs and access to capital. The macro impact of interest rates continues to be the main challenge facing commercial property, despite bottom-up demand drivers remaining relatively resilient. This is being reflected in higher capitalisation rates (effectively the earnings multiple for property), and in turn putting downward pressure on asset valuations.
In further economic data, the labour market remains tight, however there are signs of softer conditions emerging. Unemployment increased to 3.9% in November (latest available data), the highest it has been since May 2022 and slightly above consensus expectations (3.8%)3. Hours worked was flat over the month leading to a higher underemployment rate, job ads declined, and there were more applicants per job – all signs of slowing. Positively, the increase in the unemployment rate has been orderly and driven by strong population growth (i.e. supply), rather than job destruction. In fact, annual jobs growth increased to 3.2%, with 104,000 jobs created over the quarter-to-date (65% being full-time), a positive for office space demand.
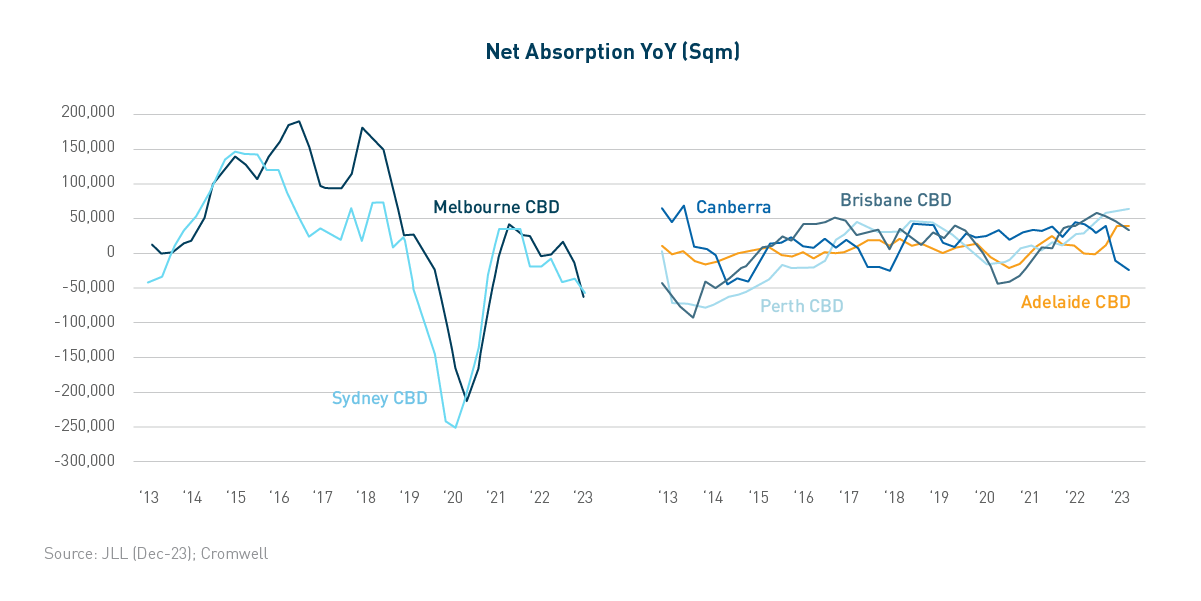
There continues to be mixed demand readings between the major CBDs, largely aligned to the different industry compositions of the markets. According to JLL Research, national CBD net absorption totalled -59,000 square metres (sqm) across the quarter, the weakest result since March 2021. The resource-based markets of Brisbane (+9,000 sqm) and Perth (+7,000 sqm) both continued their run of positive demand, recording the strongest results of the quarter. Melbourne CBD recorded the weakest net absorption on a quarterly and annual basis, due to a couple of substantial A-Grade contractions in the Parliament precinct. It was the first quarter since March 2021 where Prime net absorption was weaker than Secondary net absorption.
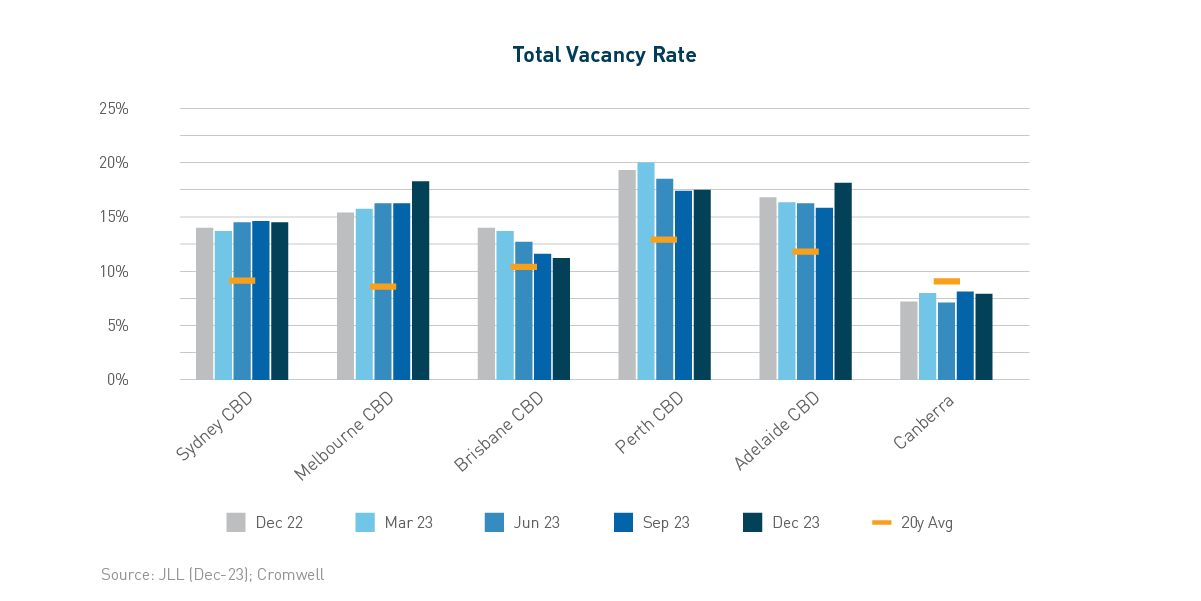
The national CBD vacancy rate increased from 14.2% to 14.9% over the quarter, with the result following a similar pattern as net absorption. Brisbane CBD (-0.4%) recorded the biggest improvement in vacancy rate, while Melbourne CBD (+2.0%) deteriorated materially, due to the occupier contractions seen in the Parliament precinct. While headline vacancy remains elevated compared to the historical long-term average, particularly across Prime stock, the majority of CBD assets remain well-occupied (<10% vacancy).
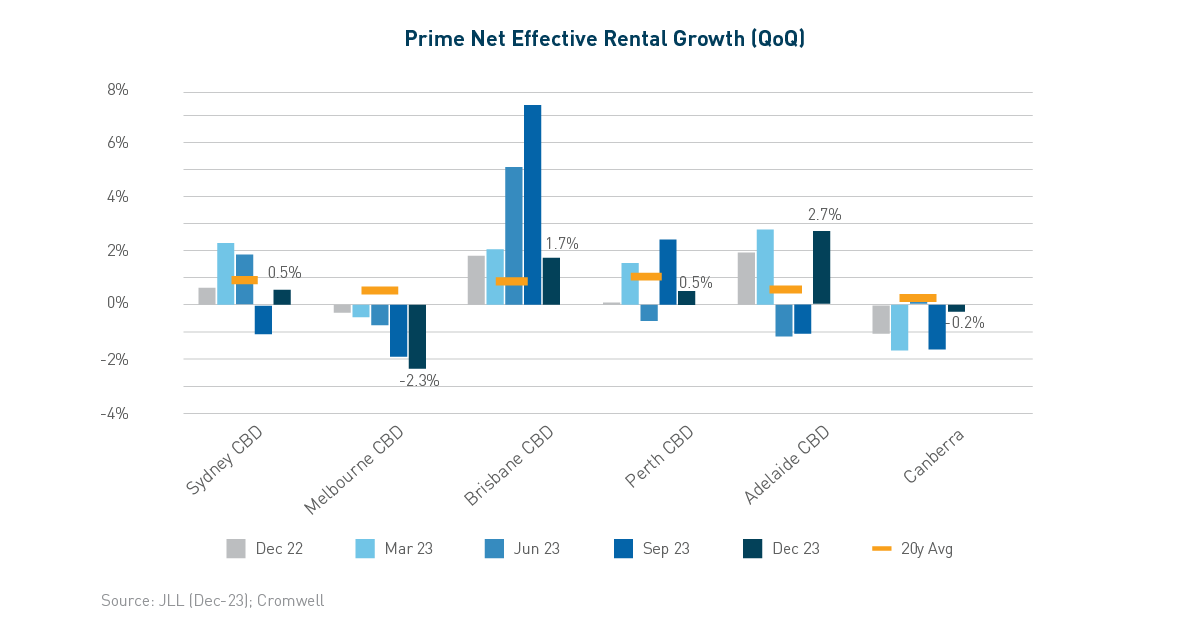
Prime net face rent growth (+0.9%) accelerated slightly compared to the prior quarter (+0.6%), with the Sydney CBD and Canberra the biggest improvers. Prime incentives were relatively stable across every CBD market except Melbourne (+1.0%) and Canberra (+0.3%). This meant that on a net effective basis, Melbourne and Canberra were the only markets where rents headed backwards over the quarter. Adelaide (+2.7%) recorded the strongest net effective rental growth, as Brisbane slowed after two quarters of very strong growth. Adelaide joined Brisbane and Perth as CBD markets where net effective rents are higher today compared to pre-pandemic.
Transaction volume for the quarter ($1.8 billion nationally) was roughly in line with the quarterly average over the rest of the year but was 66% lower than the Q4 average of the past five years4. The lack of transaction activity reflects the sharp increase in cost of capital seen over the past 18 months, and the gap between bidder and vendor price expectations which is taking time to align. It also reflects a lack of large transactions, with only one asset greater than $250 million changing hands during the quarter. This has been reflected in the total expansion of national CBD prime average yields to 120bps from peak pricing, with further expansion possible given the inherent lags in the valuation process.
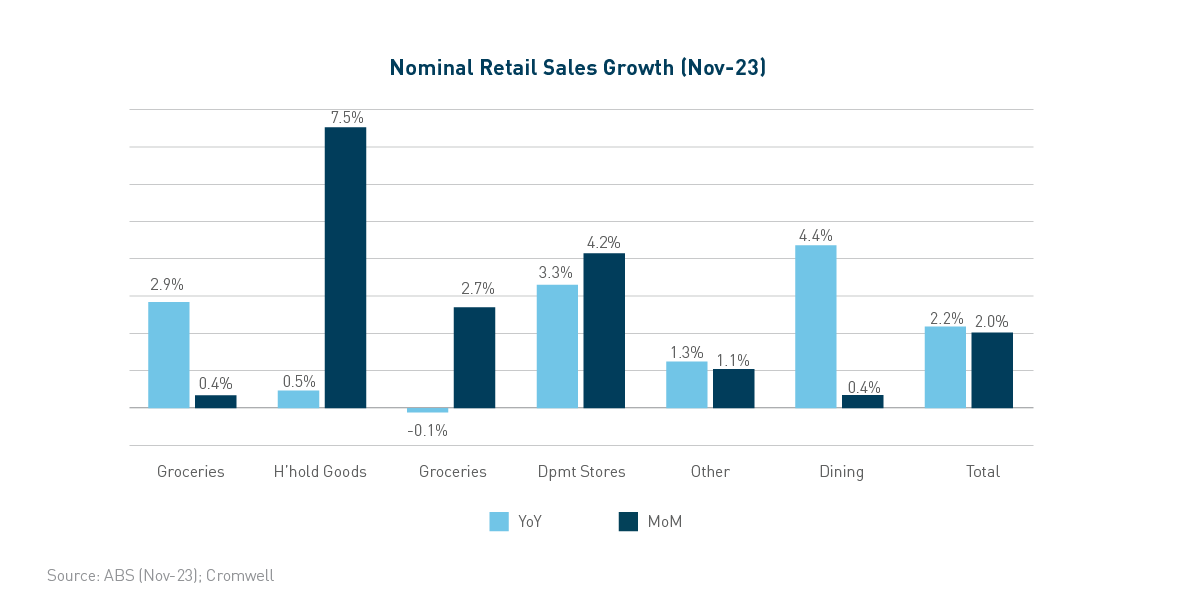
There was a large rebound in retail sales in November (+2.0%), following a slow start to the quarter in October (-0.4%)5. November’s monthly growth was the strongest result since November 2021,when activity was boosted by post-lockdown reopening. It is important to note that Black Friday sales had a large positive impact, with spending surging across household goods, department stores and clothing. A decent portion of this spending was likely ‘brought forward’ from December, so Christmas data (due 30 January 2024) may be weaker.
Consumers remain under pressure, with Westpac’s measure of sentiment up in December but still at very pessimistic levels. While real disposable household incomes should improve in the latter half of 2024, elevated inflation and interest rates are expected to dampen per capita discretionary spending for some time yet.
Rental growth at large discretionary shopping centres continues to underperform though is positive. Large Format Retail was the top-performing sub-sector over the quarter, with rental growth benefiting from a lack of new supply across 2022 and 2023. This positive supply-demand dynamic saw Large Format vacancy decline over the quarter, while the other retail sub-sectors recorded slight increases.
It was a slow quarter for retail transactions, with volume totalling less than $1 billion. No large assets changed hands, following the sales of Stockland Townsville and Midland Gate Shopping Centre last quarter. As seen across most commercial property sectors, retail capitalisation rates expanded further over the quarter.
Australia’s industrial market remains the tightest in the world, with a national vacancy rate of 1.1%6. The city-level figures are book-ended by Melbourne (1.6%) and Sydney (0.5%), while Brisbane saw the biggest increase in vacancy rate (+0.8%) over the second half of 2023. Vacancy has been rising in most offshore markets across the year and the trend has now reached Australia, reflecting ongoing supply and a softening of demand. While vacancy is increasing, it remains well below long-term average levels.
Softening of demand is consistent with a slowing global economy (hence lower trade volumes) and an unwinding of some of the e-commerce gains made through the pandemic years. However, net absorption continues to be positive, particularly in Sydney and Melbourne where newly developed stock is being readily taken up by occupiers whose expansion in prior quarters was constrained by limited availability. While the demand cycle is starting to slowly turn, low vacancy helped generate national super prime net face rental growth of 15% year-on-year as at 4Q23 (preliminary data)6. Prime incentives remain low compared to historical levels at around 10-15%.
Supply delivered in 2023 was elevated at around double long-term levels. Higher levels of supply are earmarked for completion in 2024, however delays due to planning, infrastructure servicing, and construction will likely see some of this development pushed into the following year (as was seen in 2022 and 2023). Ongoing supply will likely put upwards pressure on the vacancy rate, however solid levels of pre-commitment (already almost 50% across the East Coast) limit the risk of a blowout.
While investors remain relatively positive on the industrial outlook, as with other sectors, transaction activity was nevertheless muted. Volume over the course of 2023 was soft compared to recent record highs, but roughly in line with levels seen in the three years prior to the pandemic.
The global economy is slowing but at a relatively measured pace, engendering optimism that a “soft landing” can be achieved. Australia’s economy is in a similar position, with inflation slowing but employment conditions softening but remaining resilient. Similarly, household consumption has slowed without falling precipitously. Markets are becoming more confident that the rate hiking cycle is at or near its end, which should help ease uncertainty and improve liquidity for property over the coming months.
These factors put the Australian commercial property market in relatively good stead from a demand perspective. While a slowdown is expected over 2024 and early 2025, a more significant contraction (i.e. recession) is looking less likely. Businesses will continue to review their space requirements as they adjust to hybrid working, though the balance between in-office versus remote is expected to shift towards the office over 2024. Location continues to be an important driver of occupier preferences, combined with amenity and building quality (at a given price point).
Capital continues to view Australia as a favourable investment destination given its attractive demographic profile, growth prospects, and relative social and political stability. As uncertainty abates and liquidity improves, transaction activity should increase. The best opportunities will present where sentiment has become dislocated from market fundamentals.
On 27 October 2023, Cromwell announced the termination of the proposed merger between the Cromwell Direct Property Fund (the Fund) and Australian Unity Diversified Property Fund, as a result of deteriorating market conditions.
Given market dynamics for Australian real estate markets, and in particular potential movement in office asset valuations, the Board decided it appropriate to externally revalue the Fund’s assets to identify if any values may have moved materially owing to the nature of the assets and market circumstances. The Fund’s gross asset value experienced an 8.9% decrease. While partially offset by rental growth, this decline is mainly attributed to elevated interest rates and a softer capital market in the second half of 2023, which led to a 72bps expansion of the Fund’s weighted average capitalisation rate, which now stands at 6.87%.
Despite the valuation decline, the Fund’s asset portfolio continues to experience positive leasing activities, particularly in Brisbane. The Fund has improved occupancy (on a look-through basis) to 96.4% as of December 31, 2023.
Effective 14 November 2023, the Fund temporarily suspended new applications and ceased to offer the Distribution Reinvestment Plan (DRP). These measures will be in effect until the valuation process concludes and the audited financials for the half-year ending 31 December 2023, are released. It is anticipated that applications and DRP will be reinstated in early 2024 as this process completes.
During the quarter, the Fund implemented new hedging which lifted the hedge ratio to 51.7% against drawn balance, and produced a weighted average hedge term of 1.85 years as at 31 December 2023.
Cromwell remains committed to unlocking property value through proactive asset management, aiming to navigate the cyclical downturns in the commercial property market.
Read more about the Cromwell Direct Property Fund: www.cromwell.com/dpf.
Past performance is not a reliable indicator of future performance.
Cromwell Funds Management Limited ACN 114 782 777 is the responsible entity of and issuer of units in the Cromwell Direct Property Fund ARSN 165 011 905.
Before making an investment decision in relation to the Fund it is important that you read and consider the Product Disclosure Statement and Target Market Determination available from www.cromwell.com/dpf, by calling 1300 268 078 or emailing invest@cromwell.com.au.
Read more about Cromwell Direct Property Fund, including where to locate the product disclosure statement (PDS) and target market determination (TMD). Investors should consider the PDS and TMD in deciding whether to acquire, or to continue to hold units in the Fund.