rebeccaquade, Author at Cromwell Funds Management
Person typing on a laptop

Learn

Home Archives for rebeccaquade
June 12, 2024

An opportunity underpinned by location: why the Cromwell Healthcare Property Fund

Colin Mackay, Research and Investment Strategy Manager, Cromwell Property Group


As a property segment, medical centres have all the right ingredients to provide a compelling investment opportunity – industry-wide structural tailwinds, strong fundamentals resilient to economic cycles, alignment to government funding, and attractive investment characteristics. But like any real estate investment, location matters. In this short article, we’ll outline some of the factors that make the Cromwell Healthcare Property Fund (Fund) stand out, with its proposed acquisition of 16 Playford Boulevard, Elizabeth, South Australia (the Property).

Catchment characteristics

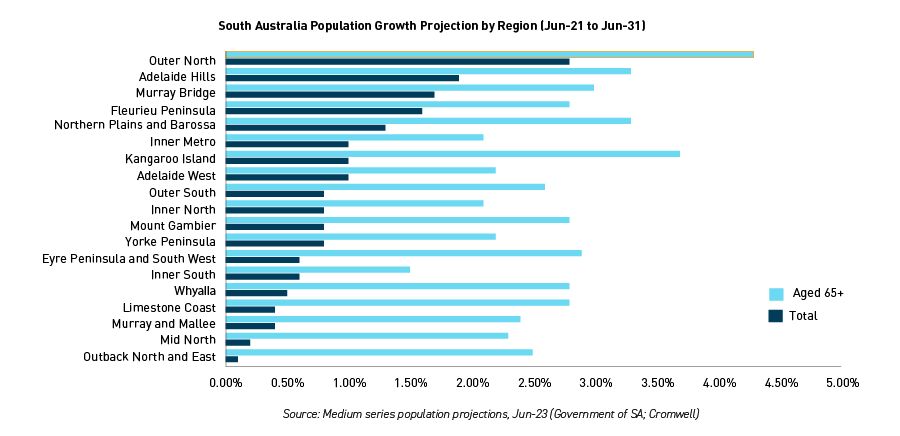
Demand for healthcare is closely linked to population growth, particularly amongst those aged over 65. The Property is located in the fastest growing region in South Australia (Outer North), with total population growth of 2.8% p.a. projected from 2021-31, and growth in the 65+ segment projected to be even more significant (4.3% p.a.). At a more granular level, the Local Government Area (LGA) in which the Property is located (Playford), is projected to see the third strongest population growth over the period, at 2.9% p.a.


Low socioeconomic status is linked to higher incidence of disease and greater need for care. Due to cost, those with more socioeconomic disadvantage have lower rates of private health coverage2. They are also less likely to see a health practitioner but more likely to visit an emergency department2, resulting in a greater number of avoidable hospital presentations which unnecessarily take up valuable resources. The Property is located in the fourth most disadvantaged LGA in South Australia (out of 71) and the lowest socioeconomic LGA within metropolitan South Australia3, which Cromwell believes indicates significant demand within the catchment for affordable, public-aligned healthcare services, such as those provided at the Property.


Important node in the Local Health Network

The Property is leased entirely to a South Australian government healthcare operator, which provides a number of important healthcare services for the Northern Adelaide Local Health Network (NALHN), including outpatient services. The main hospital servicing the NALHN, the Lyell McEwin, is the third busiest hospital in South Australia and has the highest number of non-urgent presentations4. The percentage of emergency department patients commencing treatment within the recommended time is the second lowest across South Australia5. The Property operating as a GP Plus Health Care Centre aims to help to reduce the number of unnecessary hospitalisations and better respond to the health needs of local communities6.

The Property is well placed to meet the needs of the catchment, forming part of an essential services precinct adjacent to the major shopping centre of the region. The location provides significant car parking and convenient road access, and is in close proximity to rail and bus public transport. With a substantial site area of nearly 12,000 square metres, the Property also has the potential to expand in line with growing demand for services within the region, providing continuity of care for patients.

A unique proposition

As detailed in the Product Disclosure Statement, the Fund presents a unique investment opportunity, underpinned by a property with an attractive location and catchment characteristics. The Property is located in a fast-growing region with significant need for healthcare services. The Property is well placed to meet the needs of the catchment, providing a broad range of affordable, public-aligned healthcare services. The precinct benefits of the location, adjacent to a major shopping centre and with convenient access to public transport and car parking, further enhances its long-term appeal.


Footnotes
  1. Medium series population projections, Jun-23 (Government of SA; Cromwell)
  2. Patient Experiences 2022-23 (ABS)
  3. Socio-Economic Indexes for Australia, 2021 (ABS)
  4. Emergency department care activity 2022-23 (AIHW)
  5. Emergency department care access 2022-23 (AIHW)
  6. GP Plus Health Care Services and Centres, SA Health.
Disclaimer

This correspondence has been prepared for information purposes and is not a product disclosure document or any form or offer to invest in the Cromwell Healthcare Property Fund (Fund) under the Corporations Act 2001 (Cth) (Corporations Act). This document does not constitute personal financial product or investment advice (nor tax, accounting or legal advice) nor is it a recommendation to subscribe for or acquire securities or other financial products and it does not and will not form any part of any contract for the subscription or acquisition of securities or other financial products.

Cromwell Funds Management Limited ABN 63 114 782 777 AFSL 333 214 (CFM) is the responsible entity of and issuer of the Cromwell Healthcare Property Fund ARSN 676 931 838 (Fund). In making an investment decision in relation to the Fund, it is important that you read the Product Disclosure Statement dated 27 May 2024 (PDS) and the Target Market Determination (TMD). The PDS and TMD are issued by CFM and are available from www.cromwell.com.au/chpf, by calling Cromwell’s Investor Services Team on 1300 268 078 or emailing invest@cromwell.com.au.

This communication has been prepared without taking account of your objectives, financial situation and needs. All investments involve risk and before making an investment decision, you should consider the PDS and TMD and assess with or without your financial or tax adviser whether the Fund is appropriate for you having regard to your objectives, financial situation and needs.

Any ‘forward-looking statements’ are not guarantees of future performance but are predictive in nature and are subject to known and unknown risks, uncertainties and other factors which may be beyond the control of CFM. CFM does not represent or warrant that such ‘forward-looking statements’ will be achieved or will prove to be correct, and actual variations from the projections or estimates may be material. You are cautioned not to place undue reliance on any forward-looking statements.

Cromwell Healthcare Property Fund

Healthcare property investment opportunity | Open for investment

Person typing on a laptop

Learn

Home Archives for rebeccaquade
May 1, 2024

ESG improvements key to Cromwell Direct Property Fund longevity

Cromwell Property Group is continuously looking at ways to increase the value of our properties – and generate long-term income – while progressing our own environmental, sustainability, and governance (ESG) ambitions and meeting the ESG expectations of investors, tenants, and regulatory bodies.

Efforts to conduct decarbonisation assessments for assets in the Cromwell Direct Property Fund (DPF) portfolio are currently underway ­– and, when complete, will help to establish  strategy for each building to optimise energy efficiency, with any remaining emissions offset to achieve net zero. It is expected that this round of assessments are due to be completed by late 2024.

Six buildings in the DPF portfolio have had their base building electricity requirements powered by 100% renewable electricity – via the Australian Government’s certified GreenPower program – since January 2024. These are:

  • 100 Creek Street, Brisbane
  • 420 Flinders Street, Townsville
  • 433 Boundary Street, Brisbane
  • Altitude Corporate Centre, Mascot
  • Energex House, Newstead*
  • 19 George Street, Dandenong *

Cromwell Group Head of ESG Lara Young said that the progress being made on ESG targets within the Cromwell Direct Property Fund portfolio – and the business more broadly – was a sign that Cromwell is finding ways to generate long-term, sustainable growth.

“To ensure that we maintain optimal returns over the longest possible duration – that the assets we provide generate the returns expected – we need to ensure that ESG is genuinely integrated and brought to life across all the activities we undertake, across all our investments,” said Ms. Young.

“We want to continue to be able to have best-in-class assets and attract the types of blue-chip tenants that we’ve made a name for ourselves doing.”

“By undertaking these types of activities, we’re creating a way to deliver financial returns, while reducing environmental impacts.”

By undertaking these types of activities, we’re creating a way to deliver financial returns, while reducing environmental impacts.
Lara Young, Group Head of ESG

Stage 2 solar installation completed

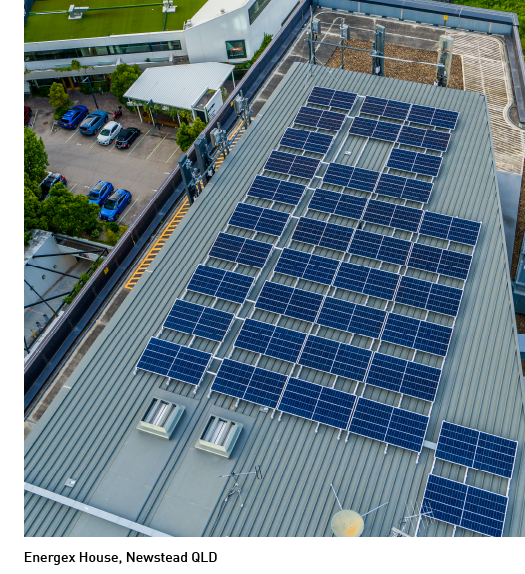
Cromwell has completed Stage 2 of our programme of works to install solar panels on buildings at locations across the country, as part of the business’s commitment to meet our long-term ESG targets.

The months-long project stage saw approximately 930 individual solar panels installed across the roofs of six different assets, including four buildings in the Cromwell Direct Property Fund:

  • Energex House, Newstead – 100Kw system
  • 163 O’Riordan Street, Mascot – 100Kw system
  • 19 George Street, Dandenong – 100Kw system
  • 420 Flinders Street, Townsville – 39.9Kw system

Cromwell Project Manager Tarek Ayoubi said each installation process presented different challenges, though the initial approach remained largely the same.

“We followed a similar methodology at most locations, then made allowances for different spaces and installation requirements,” said Mr. Ayoubi.

“This involved the head contractor working with other local contractors to develop a roll-out plan; establishing the position of the panels for the best sun exposure, while maintaining safe access to the roof; and engaging a structural engineer to advise on the proposed installation method and location.”

“It was important to manage power connections, while maintaining minimum impact on tenants – and then coordinate with the local grid supplier for approval, before commissioning and energising the system.”

“All works were completed in coordination with Cromwell’s facility managers, to ensure the projects were delivered to a high standard and with no interruption to tenants.”

“The Flinders Street building in Townsville was arguably the most challenging installation, due to unpredictable weather and structural conditions, which meant we had less flexibility than at other sites; however, we were able to make the most of the space available to us.”

The Stage 2 solar installation is part of Cromwell’s broader commitment to transition to a Portfolio Net Zero target for operational control buildings by 2035.

Cromwell’s solar programme had generated 737 megawatt-hours for FY23 and was accounting for $165,000 in estimated savings per annum (with an average ROI of three years). This is the equivalent of reducing 538 tonnes of carbon dioxide equivalent – or approximately the emissions generated by 95 average households.


*The Fund holds an indirect interest in the property via an investment in the underlying managed investment scheme, of which CFM is the responsible entity. The underlying scheme is closed to investment.

Person typing on a laptop

Learn

Home Archives for rebeccaquade
April 30, 2024

Getting the right healthcare property exposure: why medical centres

Colin Mackay, Research and Investment Strategy Manager, Cromwell Property Group


Healthcare property encompasses a range of asset types such as hospitals, medical centres, and aged care facilities. As outlined in the previous article of this series, the healthcare industry is benefitting from several demand tailwinds. However, it’s not all smooth sailing, as evidenced by recent news of private hospital closures1. In this article, we’ll explain why we believe medical centres is the specific property segment investors should prioritise.


A necessary care model

As the population ages, the supply of health services is struggling to keep up with demand, resulting in higher costs and longer wait times. Inadequate financial and labour resources are available to improve care standards or wait times under the status quo – a more efficient and cost-effective system is required.

public hospital elective surgery wait times

Part of the required shift includes moving treatment out of hospitals and towards GPs and other primary or secondary care facilities. Focusing on primary healthcare and out-of-hospital care can result in better health outcomes2, reduced risk of infection and improved patient comfort, convenience, and satisfaction3,4. From a funding perspective, out-of-hospital care can be cheaper due to lower overheads compared to when a hospital bed is occupied4.

Avoidable emergency department presentations are clogging the hospital system, with an estimated 1.9 million preventable patient days per annum from those aged 65+ alone5. It would be more appropriate to provide this care in an efficient, fit-for-purpose medical centre environment, saving costs and freeing up hospital resources for actual emergency care and complex cases.

The shift from hospital to non-hospital care is already underway and evidenced by growth in primary healthcare spending outpacing spending on hospitals, as well as government policies putting greater emphasis on primary care and preventive health. For example, the Federal Government has announced a $99m initiative to connect frequent hospital users with a GP to reduce the likelihood of hospital re-admission, and $79m in funding to support the use of allied health services for multidisciplinary care in underserviced communities6.

GROWTH IN PRIMARY HEALTHCARE SPENDING IS OUTPACING SPENDING ON HOSPITALS

Attractive investment characteristics

In addition to demand and funding tailwinds, medical centres offer several attractive investment characteristics:

High quality cashflow
derived from a reliable tenant base
A hedge against inflation
via CPI-linked or fixed rental escalations
Long leases (typically 5-15 years)
sometimes on a triple net basis
Higher rates of lease renewal
compared to traditional office7

Compared to private hospitals, medical centres may be preferred due to deriving income from a typical commercial lease structure, rather than a percentage of operator EBITDAR. Land also typically comprises a greater proportion of asset value, which can provide downside protection and aid long-term development or change of use potential.

 
Private Hospitals
Medical Centres
Lease term 20-30 years 5-15 years
Basis of income Percentage of operator EBITDAR, quoted on per bed basis Typical commercial lease structure, quoted per sqm
Tenant profile Single operator One or several tenants
Capital intensity Very high Moderate to high

Summarised from Exploring Australian healthcare opportunities, JLL (Jun-23)

An increasingly important part of the healthcare landscape

Medical centres are an increasingly important part of the healthcare landscape, representing efficient and fit-for-purpose facilities that can help alleviate the capacity constraints of hospitals and improve the sustainability of the health system.

We believe medical centres’ alignment with demand trends and Government healthcare spending priorities, together with attractive investment characteristics such as CPI-linked income and defensive land holdings, puts them in a favourable position compared to other healthcare property investments.


Footnotes
  1. Ramsay Health Care warns of hospital closures as costs blow out, AFR (Feb 29th, 2024)
  2. How much of Australia’s health expenditure is allocated to general practice and primary healthcare?, M. Wright; R. Versteeg; K Gool (Sep-21)
  3. Out-of-hospital models of care in the private health system, Australian Medical Association (Oct-23)
  4. There’s no place like home: reforming out-of-hospital care, Private Healthcare Australia (May-23)
  5. Health is the best investment: shifting from a sickcare system to a healthcare system, Australian Medical Association (Jun-23)
  6. Federal Budget 2023-24, Treasury (2023)
  7. Exploring Australian healthcare opportunities, JLL (Jun-22)

Cromwell Healthcare Property Fund

Healthcare property investment opportunity | Launching soon

Person typing on a laptop

Learn

Home Archives for rebeccaquade
April 22, 2024

March 2024 direct property market update

Economy

The disinflation cycle is in the ‘last mile’, where monetary policy is being finely calibrated and market expectations can move month-to-month with each new data release. This was reflected in the RBA’s stance at the March Board meeting, where Australia’s central bank arguably kept a foot in both the tightening and neutral camps. However, much of the market’s speculation is focused on when rate cuts will occur, rather than the genuine possibility of further hikes. As at the end of March, financial markets and the major banks were forecasting the first cut to occur in the final quarter of 2024.

Annual inflation was stable at 3.4% in February (data released March), with rent and insurance inflation remaining stubbornly high, and goods inflation continuing to be moderate. However it is the tightness of the labour market (services inflation) which will likely be the key determinant of the CPI path moving forward. On this front, the unemployment rate fell from 4.1% in January to 3.7% in February1. The magnitude of the decrease is surprising at first glance, but less unexpected when you look at the detailed data which shows a shift in the seasonality of the labour market. It is now becoming the ‘new norm’ for workers to end a job in December and not start a new one until February. Labour data has also shown more volatility month-to-month since the pandemic. Looking at the recent trend rather than the latest monthly print in isolation shows the labour market is gradually softening, with underemployment (people wanting more hours) at its highest level since December 2021 and leading indicators such as job vacancies falling (albeit from high levels).


Retail sales provide another indication of a slowing economy. While Taylor Swift’s recent tour boosted February spending on clothing, department stores and dining in New South Wales and Victoria (the locations of the concerts), annual nominal growth of only 1.6% was recorded2. Considering inflation is running above 3% and population growth of circa 2.5%, underlying consumption is very weak, showing that the cost of living is clearly biting. However, consensus expectations are that there should be some relief towards the end of the year as stage 3 tax cuts flow through, inflation continues to moderate, and interest rates potentially ease.

A part of the economy bucking the slowdown trend is housing; reflecting robust demand and constrained supply. CoreLogic’s national Home Value Index recorded its 14th consecutive month of growth in March, rising to new record highs each month since November 20233. There is a risk sustained house price growth may influence the RBA’s view of the appropriate rate path, however as previously stated, the health of the labour market will likely be a much greater focus.

Office

The office market recorded a positive result in the March quarter. According to JLL Research, national CBD net absorption totalled just over +33,000 square metres (sqm), the strongest result since March 2023. Sydney was the top-performing market after three weak quarters prior, while Perth was the only major CBD market which saw demand decline as a result of softening in the non-Premium grades. On an annual basis, net demand is still strongest in the smaller markets of Adelaide, Brisbane, and Perth.


The national CBD vacancy rate was flat at 14.7%, with every CBD market except Perth and Canberra recording an improvement in supply-demand conditions. While the softening in Perth was due to both new supply and weaker demand, the increase in Canberra vacancy was entirely driven by the addition of new stock (completion of a refurbishment). Nationally, Premium assets saw the greatest improvement in vacancy rate.

Prime net face rent growth (+1.4%) accelerated further compared to the prior quarter (+0.9%), with the Brisbane CBD and Adelaide CBD the top performers. Prime incentives were largely flat (+0.1%), with half of the markets recording minor increases (Sydney, Melbourne, Perth), offset by the other half recording minor improvements. This meant on a net effective basis, Adelaide and Brisbane recorded the strongest growth, with Melbourne the only market to head backwards.


Reflecting the continued softness in conditions, transaction volume for the March quarter ($1.0 billion nationally) was roughly in line with the quarterly average over the prior 12 months but 64% lower than the Q1 average of the previous five years. Having said that, it was the highest number of sales seen since December 2022, highlighting that the smaller end of the market remains more active than larger lot sizes. The lack of transaction activity reflects the sharp increase in cost of capital seen over the past 24 months. This has resulted in national CBD prime average yields softening a further 29bps over the quarter. The national movement in yields may not be directly reflective of individual portfolios or assets, given differences in the timing of valuation processes.

Retail

While annual rental growth remains soft, it is consistent and broad-based. According to JLL Research, across large discretionary shopping centres (Regionals) gross rental growth averaged +0.1% for the quarter and +0.5% for the year, with every market recording a similar result. Growth across Sub-Regionals was slightly stronger at +0.2% and +0.8%, representing nine consecutive quarters of rental increases. Neighbourhood centres also recorded growth of +0.2% for the quarter, taking annual growth to +0.6%. Sydney and South-East Queensland, which have the highest Neighbourhood rents per sqm, recorded slightly weaker growth than the other markets.

It was a very slow quarter for retail property transactions, with volume totalling just over $500 million. No Regional assets changed hands for the first time since September 2022, dragging the dollar value of activity lower. It was quiet across the other centre types as well, with Sub-Regionals the most active relative to the five-year average. While yields did expand further over the quarter, it was to a lesser extent than office and industrial reflecting the higher starting point of retail yields prior to the hiking cycle.

While yields did expand further over the quarter, it was to a lesser extent than office and industrial reflecting the higher starting point of retail yields prior to the hiking cycle.

Industrial

Gross occupier take-up softened materially over the quarter as inventory levels contracted and the broader economy slowed. Transport and Warehousing continues to comprise the greatest share of demand from an industry perspective, with Manufacturing take-up also remaining at a solid level. The big driver of the slowdown was Retail and Wholesale Trade, which saw demand fall by around 90% compared to the five-year average. This may reflect cautiousness from occupiers in the face of weak retail sales and declining global trade volumes, together with a ‘pause’ to expansion after substantial take-up during the pandemic. From a market perspective, Sydney saw the largest slowdown in demand, with South-East Queensland and Perth holding up well.


While rental growth is slowing from record highs, it remains well above trend, consistent with tight vacancy conditions. Melbourne saw the strongest growth, with Melbourne West the top-performing precinct nationally (+8.0% QoQ). Brisbane growth was robust in the infill Trade Coast precinct, while the land constrained South precinct was the top performer in Sydney. Rental growth in Sydney’s Outer Central West, where land is more abundant, was not as strong.

Almost 500,000sqm of industrial supply was completed in the first quarter of 2024. A further two million sqm4 of supply is slated for completion over the balance of the year, however construction delays may see timings slip. If all the projected supply is completed in 2024, it would represent the second highest level of completions in a calendar year behind 2022 (2.7m sqm). Projects are heavily concentrated in the land-rich, outer precincts, with 66% of expected 2024 supply to occur in just four precincts (of 22 nationally). Ongoing elevated levels of supply will likely lead to greater availability of space and a further softening of rental growth.

There was a rebound in transaction activity over the quarter, with dollar volumes exceeding the five-year average and hitting the highest level since September 2022. Activity was dominated by Sydney, in particular ISPT and Unisuper’s joint acquisition of a 280 hectare greenfield development site in Badgerys Creek. Consistent with other sectors, prime industrial yields expanded over the quarter along the East Coast, with the smaller markets of Adelaide and Perth unchanged. Sydney saw the greatest degree of softening, but still has the tightest yields nationally.


Outlook

The global economy is slowing but at a relatively measured pace, engendering optimism that a “soft landing” can be achieved. Australia’s economy is in a similar position, with inflation slowing but employment conditions remaining resilient. Markets are becoming more confident the rate hiking cycle is at or near its end, which should help ease uncertainty and improve liquidity for property later in the year.

While an economic slowdown is expected over 2024 and early 2025, a more significant contraction (i.e. recession) is looking less likely. Businesses will continue to review their space requirements as they adjust to hybrid working, though the balance between in-office versus remote is expected to shift back towards the office over 2024. Location continues to be an important driver of occupier preferences, combined with amenity and building quality (at a given price point).

How did the Cromwell Funds Management fare this quarter?

With the Cromwell Direct Property Fund’s property portfolio completely revalued externally in November and December 2023, no external revaluations were completed in the March quarter. With the revaluation process and half-year accounts released, the Fund recommenced accepting applications and offering the Distribution Reinvestment Plan (at a 5% discount) from 25 March 2024.

The Fund continues to experience positive leasing outcomes, especially in its Brisbane based assets. The strategy to build quality speculative fitouts and improving amenity with 3rd spaces has helped improve occupancy metrics, tenant engagement, and improving rental growth.

Both the Cromwell Riverpark Trust’s Energex asset (CRT) and Cromwell Trust 12’s Dandenong asset (C12) had solar panels installed. The installation is awaiting grid approval, and the work will help maintain (for CRT) and obtain (for C12) a 6-star NABERS rating.

Read more about the Cromwell Direct Property Fund: www.cromwell.com.au/dpf.

Past performance is not a reliable indicator of future performance.

Cromwell Funds Management Limited ACN 114 782 777 is the responsible entity of and issuer of units in the Cromwell Direct Property Fund ARSN 165 011 905.

Before making an investment decision in relation to the Fund it is important that you read and consider the Product Disclosure Statement and Target Market Determination available from www.cromwell.com.au/dpf, by calling 1300 268 078 or emailing invest@cromwell.com.au.


  1. Labour Force, ABS
  2. Retail Trade, ABS
  3. Hedonic Home Value Index, CoreLogic
  4. Projects with a status of Under Construction, Plans Approved, or Plans Submitted
About Cromwell Direct Property Fund

Read more about Cromwell Direct Property Fund, including where to locate the product disclosure statement (PDS) and target market determination (TMD). Investors should consider the PDS and TMD in deciding whether to acquire, or to continue to hold units in the Fund.

Person typing on a laptop

Learn

Home Archives for rebeccaquade
April 22, 2024

An essential and resilient sector: why healthcare property

Colin Mackay, Research and Investment Strategy Manager, Cromwell Property Group


The healthcare and social assistance sector is an essential and growing industry, accounting for 8% of the Australian economy1 and 16% of employment2. It is expected to see the biggest increase in government funding from 2022-23 to 2062-63, with government health spending per capita forecast to grow by 2.0% p.a. on an inflation-adjusted basis3. In this short article, we’ll provide a brief overview of healthcare’s key growth drivers, and why healthcare property presents a compelling investment opportunity for income-oriented investors seeking stability and diversification.

Demographic tailwinds

Growth in Australian healthcare is underpinned by several long-term demographic trends, which are spurring demand for care services. Firstly, Australia is forecast to experience the strongest population growth across developed economies over the next decade4. On top of broad-based population growth, there is an even more pronounced “population bulge” now sitting in the 65+ age bracket due to the post-war baby boom. Life expectancy is also rising, up from 78 years (men) and 83 years (women) two decades ago to 81 and 85 today, with the rising trend expected to continue3. These factors mean the number of people aged 65+ will more than double and the number aged 85+ will more than triple over the next 40 years. As we live longer, the proportion of our lives lived in “full” health is slowly declining, meaning a longer period of time where health services and care are needed per person.

People aged 65+ currently account for 40% of government health spending despite being only 16% of the population.

Rising disease incidence

Naturally, an ageing population also means rising disease incidence and complexity. People aged 65+ currently account for 40% of government health spending despite being only 16% of the population3, with 95% of those aged 65+ having two or more chronic health conditions, compared to 59% of those aged 15-444. This is being exacerbated by lifestyle factors, such as poor diets and lack of exercise, and improved medical detection and diagnostics, which are seeing the rates of disease incidence also increase on an age-standardised basis5.


Non-cyclical demand

Healthcare is a defensive, necessity service resilient to fluctuations in the economic cycle. Since gross value added data by industry has become available, healthcare has only contracted in 37 of 197 quarters, making it the second most consistently expanding industry behind Education, which has contracted in 25 quarters1. By comparison, cyclical industries such as mining and construction have contracted in 69 and 71 quarters respectively.

Volatility in healthcare demand is lower than in other industries, and growth has also typically occurred even during periods of recession or global economic disruption (e.g. the GFC). In fact, annual growth in gross value added has never been negative for more than one consecutive quarter, with the worst result (-5.0%) recorded during the COVID-19 pandemic when most health services were shutdown. Even during the pandemic, the sector experienced a sharper recovery than the broader economy.

Strong fundamentals

The healthcare sector in Australia is an essential and growing industry. Underlying demand is being driven by long-term demographic trends such as population growth, the ageing population, and longer life expectancy. Rising disease incidence and complexity add further to the growing need for healthcare services and facilities. Demand is non-cyclical and resilient to economic fluctuations, making healthcare property assets a compelling investment for income-oriented investors seeking stability and diversification.


  1. National Accounts, ABS (Dec-23)
  2. Labour Force, ABS (Feb-24)
  3. Intergenerational Report 2023, Commonwealth of Australia (Aug-23)
  4. 10-year average growth from 2024-33 based on UN median population projections for ‘More Developed Regions’ excluding Holy See
  5. National Health Survey 2022, ABS (Dec-23)

Cromwell Healthcare Property Fund

Healthcare property investment opportunity | Launching soon

Person typing on a laptop

Learn

Home Archives for rebeccaquade
April 22, 2024

March 2024 quarter ASX A-REIT market update

Stuart Cartledge, Managing Director, Phoenix Portfolios


Market Commentary

The S&P/ASX 300 A-REIT Accumulation Index continued its march higher in the first quarter of 2024, gaining 16.2%. Property stocks meaningfully outperformed broader equities in the quarter, with the S&P/ASX 300 Accumulation Index adding a lesser 5.4%. This outperformance was predominantly driven by the 33.6% return of Goodman Group (GMG), which is the largest component of the property index, with a weighting of approximately 36%. The median return of stocks in the property index was a lesser 6.2%. Of 33 stocks within the index, only five were outperformers.

During the quarter, companies under coverage reported financial results for the period ended 31 December 2023. In general (with some notable exceptions), financial results were marginally better than expectations, demonstrating the resilience of property income streams. Outlook statements tended to acknowledge uncertainty, as the future path of interest rates remains a key input into likely outcomes.

Retail property was one of the stronger subsectors in the March quarter. Results released in February’s reporting season showed solid sales growth within shopping centres and even more impressive were the much-improved re-leasing spreads. Owner of Australian Westfield shopping centres, Scentre Group (SCG) led the way, gaining 16.2%, whilst foreign owner, Unibail-Rodamco-Westfield (URW) also moved sharply higher, adding 14.8%. Peer, Vicinity Centres (VCX) underperformed the index, but performed strongly, up 7.3%. Owners of smaller neighbourhood shopping centres didn’t keep up with their larger competitors, with Region Group (RGN) lifting 5.8% and Charter Hall Retail REIT (CQR) finishing the quarter 2.8% higher.

Once again it was office property that was the laggard as elevated vacancy and incentives continue to create concern about the prospects of office ownership. Dexus (DXS) materially underperformed the index, up 3.0%. Centuria Office REIT (COF) was weaker still, adding only 1.9%, whilst GDI Property Group (GDI) lost 5.4%. Large capitalisation office owner GPT Group (GPT) also had a tough quarter, losing 1.5%.

Returns of property fund managers were mixed through the quarter. As previously discussed, it was GMG that dominated all comers. HMC Capital Limited (HMC) outperformed, finishing the quarter 17.7% higher, but much of its performance was tied to non-property funds management targets. Charter Hall Group (CHC) also performed solidly, gaining 14.2%. Centuria Capital Group (CNI) couldn’t keep up with peers, losing 0.3% whilst Elanor Investors Group (ENN) gave up 12.2%.

For some time, we have highlighted the disconnection between private real estate valuations and public real estate equity share prices. It is inevitable, given time, that this gap closes. This can occur through private market devaluations, share price appreciation or M&A transactions serving to close the gap (or some combination of those options). During the quarter we have seen a combination of all three, with valuations moving marginally lower, share prices moving meaningfully higher and we have also begun to see some M&A activity. Each of Newmark Property Group (NPR), Eureka Group Holdings (EGH) and Hotel Property Investments (HPI) received takeover bids or had strategic parties acquire large stakes in the companies. Each of these companies were amongst the few outperformers in the quarter. Should small capitalisation securities continue to underperform, we would expect M&A activity to be an ongoing feature of the market.

Market outlook

The listed property sector is in good shape and provides investors with the opportunity to gain exposure to high quality commercial real estate at a meaningful discount to independently assessed values. While share market volatility may be uncomfortable at times, the offset is liquidity, enabling investors to rebalance portfolios without the risk of being trapped in illiquid vehicles.

Rising interest rates have been a headwind for many asset classes, with property, both listed and unlisted, a particularly interest rate sensitive sector. The February reporting season saw stocks providing solid updates, with cautiously optimistic outlooks, based on the assumption that interest rates may have peaked. Long term valuations are driven by “normalised” interest costs, meaning the impact of short term hedges maturing is mostly immaterial. Should the forecast decline in interest rates eventuate, recent headwinds may dissipate and possibly reverse.

The industrial sub-sector continues to be the most sought after, given the tailwinds of e-commerce growth, the potential onshoring of key manufacturing categories and the decision by many corporates to build some redundancy into supply chains to cope with current disruptions. All of these factors are contributing to ongoing demand for industrial space, which is evident by rapidly accelerating market rents and vacancy rates at historic lows of around 1% in many markets.

We remain cognisant of the structural changes occurring in the retail sector with the growing penetration of online sales and the greater importance of experiential offering inside malls. Recent performance of shopping centre owners has however been strong, with consumers showing resilience. It is interesting to note the juxtaposition of very high retail sales figures despite very low levels of consumer confidence, no doubt impacted by rising costs of living. Importantly, we are also now seeing positive re-leasing spreads in shopping centres, indicating strengthening demand from retail tenants.

The jury is still out on exactly how tenants will use office space moving forward, but demand for good quality well located space remains. Leasing activity is beginning to pick up, and there has also been some transactional activity, albeit at prices typically at discounts to book values. Incentives on new leases remain elevated.

We expect to see further downside to asset values in office markets, but elsewhere expect market rent growth to largely offset cap rate expansion, particularly in industrial assets. Listed pricing provides a buffer to such movements.

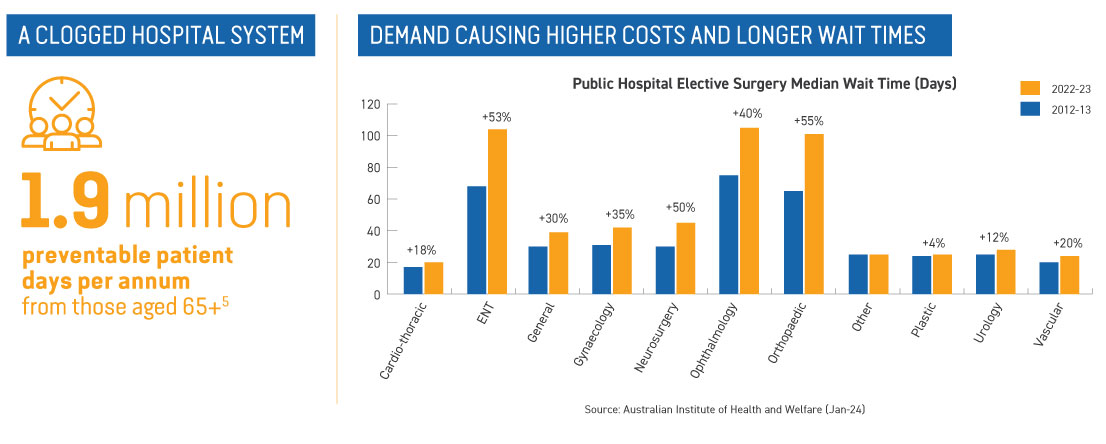
About Stuart Cartledge

Stuart is the Managing Director of Phoenix Portfolios and the portfolio manager for each of the company’s property portfolios. Prior to establishing the business in 2006, Stuart built a strong track record in the listed property security asset class and has been actively managing securities portfolios since 1993. Stuart holds a master’s degree in engineering and management from the University of Birmingham and is a Chartered Financial Analyst.

The content above is taken from the Cromwell Phoenix Property Securities Fund quarterly report. Sign up here to be the first to access the latest report and to gain a deeper insight into the Fund’s performance.

Performance commentary

Fill out the form below to view the full commentary.

I'm interested in:

All personal information submitted will be treated in accordance with our Australian Privacy Policy. By submitting personal data to Cromwell Funds Management, you agree that, where it is permitted by law and in accordance with our Australian Privacy Policy or where you have agreed to receive communications from us, Cromwell Funds Management may use this information to notify you of our products and services and seek your feedback on our products and services. Please note you can manually opt out of any communications.

Person typing on a laptop

Learn

Home Archives for rebeccaquade
January 22, 2024

Cromwell releases annual ESG report, details full scope 3 inventory


In January, Cromwell released its most detailed, comprehensive ESG report to date. This report serves as a snapshot of how the business is progressing towards meeting our environmental, social, and governance commitments over the short and long-term.

The report was developed in collaboration with all relevant disciplines across the global business, and aligns with major reporting standards, including the Sustainability Accounting Standards Board and the Global Reporting Initiative. It has been designed to provide transparency through qualitative and quantitative data, while showcasing the Group’s effort to deliver tangible positive impacts, citing case studies from across the business.

Most significantly, in line with the organisation’s desire for greater transparency, this recent report details Cromwell’s full scope 3 emissions inventory disclosure for the first time.

What ESG progress means for investors

Increasingly, ESG reporting is being used by investors as another way to track an organisation’s activities and keep businesses accountable for their actions. Some investors use ESG results to determine poor performers, associating the factors that cause companies to receive low ESG ratings with weak financial results; some investors seek out high ESG performers, expecting exemplary ESG outcomes to drive superior financial results.

ESG reports are a key source of ESG performance information relied on by investors and stakeholders to make informed decisions about an organisation’s impacts. Investor and stakeholder expectations around ESG disclosure are increasing and reporting standards are rising to respond to that expectation.

Indeed, the term “ESG” was first mentioned in the United Nations Global Compact “Who Cares Wins” report in 2004 and has now become synonymous with the ability to demonstrate good corporate citizenship. Industry trends, as well as independent studies, indicate that investors are now wanting to see tangible ESG results.

A 2022 Ernst & Young Global Corporate Reporting Survey, released in November that year, found that 78% of investors want companies to focus on environmental, social, and governance activity, even if it hits short-term profits.

These days, a company’s risk profile is raised in the eyes of investors if it fails to consider ESG risks adequately and disclose its approach to them. Among other things, this makes it difficult for a company to access capital and can over time, render it ‘un-investable’ to investors, many of whom now have ESG or green mandates.


ESG and our tenants

As a commercial real estate investor and property manager, meeting the diverse needs of our tenants remains a high priority.

Through regular, ongoing engagement and detailed annual surveys, our tenants have outlined that helping meet their own ESG requirements and ambitions needs to be a key priority for Cromwell as the building owner. By helping meet these needs, we significantly increase tenant retention across our portfolio – and attract new long-term blue-chip tenants.

Cromwell’s October 2023 Tenant Satisfaction Survey Portfolio results showed that 66% of respondents rate sustainability as important or very important in their organisation’s decision to lease; and almost 60% of respondents are already at net zero, considering net zero, or already working to become net zero organisations.

For instance, over the past 12-24 months, state and federal government departments have put increased emphasis on restricting leasing properties that can’t demonstrate a credible net zero pathway for the building.

With government tenants making up a significant percentage of our Australian leasing pool, Cromwell has committed to ensuring that we take necessary steps in improving our ESG performance to retain these crucial tenants.

In this way, we satisfy current tenant needs – and future-proof existing buildings – to increase tenant retention, improved rental yields, and deliver for our investors.

This report covers Cromwell Property Group’s environmental, social and governance (ESG) performance for the year ending 30 June 2023.

The significance of understanding scope 3 emissions

Scope 3 emissions – also known as ‘value chain’ emissions – are indirect greenhouse gas emissions both upstream and downstream of an organisation’s main operation. Consequently, for this reason, they are also traditionally the most challenging emissions scope to calculate and address for many businesses as they are not directly controlled by the organisation.

Regardless, the UN Global Compact has found that scope 3 emissions generally make up more than 70% of an organisation’s total emissions footprint and it is accepted that understanding them is critical to identifying the greatest reduction hotspots, avoiding future value chain risks associated with the transition to a zero-carbon economy, and mitigating against greenwashing.

Group Head of ESG Lara Young said that reducing scope 3 emissions, and including this emission scope in net zero carbon targets, is critical to ensuring legitimate net zero targets that deliver tangible change. Addressing scope 3 emissions, she said, can deliver substantial business benefits by providing a clear transparency, understanding, governance, and oversight of an organisation’s full value chain and the evidence of the positive impacts delivered.

“Despite the industry challenges of data quality and availability for scope 3 emissions, the Group is proactive with joint venture partners in Oceania – and its supply chain partners, clients, and tenants globally – to collate scope 3 data via the roll-out its green lease initiative and ESG schedules,” said Ms. Young.

“Cromwell has committed to positively contributing to the communities in which we operate, and that goal involves supporting tenants and investors with achieving their net zero targets and evolving ESG needs.”

“Cromwell’s FY23 ESG report is the first time that Cromwell will publicly disclose scope 3 emissions, and this will place the Group among the minority of industry peers that publicly disclose this data. This outcome is a testament of the Group’s capability and desire for full transparency.”

Cromwell’s FY23 ESG report is the first time that Cromwell will publicly disclose scope 3 emissions, and this will place the Group among the minority of industry peers that publicly disclose this data.
Lara Young – Group Head of ESG, Cromwell Property Group


Progressing on our ESG commitments

The FY23 ESG report shows that Cromwell made notable advancements toward our ESG commitments during FY23 – including the development and implementation of our updated ESG Strategy; preparing a globally aligned approach to decarbonising the business to meet our targets of net zero scope 1 and 2 emissions by 2035, and all scope 1, 2, and 3 emissions by 2045.

This activity is supported by emissions abatement cost modelling for our Australian and European portfolios to facilitate emissions reductions and associated decarbonisation costs.

The report also highlights the progression the business has made in the past 12 months regarding specific ESG results. Among our key achievements, emissions intensity (scope 1, 2, and 3) was reduced by 12% in Australia, compared to the previous financial year; European assets recorded reductions of 22%.

Cromwell’s Direct Property Fund was third in the Australian NABERS Sustainable Portfolio Index (SPI) – the highest ranked geographically diversified fund in Australia – and Cromwell’s Australia investment portfolio was fourth in the same index.

Cromwell Polish Retail Fund (CPRF) achieved a five-star rating and a Cromwell record-high overall score of 90 points, ranking 11th out of 32 European retail non-listed peer funds and 17th out of 87 in the European Retail category.

And, significantly, Cromwell’s Australian gender pay gap decreased by 44% since it was first calculated in FY21.

Lara Young said that, among other metrics, these key achievements highlighted the progress the organisation is making.

“We know that ESG is not just about carbon emissions. While reducing emissions is crucial, this cannot be at the expense of biodiversity, social value, or natural capital. These topics are all interlinked and the Group recognises we cannot be successful if focusing on each in isolation,” said Ms. Young.

McKell Building case study

One of the largest, and most involved, ESG-led projects this year was the electrification of the McKell Building in Sydney’s CBD.

The multi-million-dollar project has involved converting the building’s existing commercial gas-fired heating system to an electric heat-recovery reverse cycle heating, ventilation, and air conditioning (HVAC) system.

Cromwell’s Head of Property Operations, Tessa Morrison, said the upgrade of the 24-storey building has been designed to help ‘future-proof’ the asset by replacing outdated, 1970s-era infrastructure with modern, energy saving equipment.

““The McKell building is a 1970s-constructed building with an existing NABERS 5.5 Star energy rating, so while it is already significantly energy efficient, we are undertaking this project to reduce emissions and drive further energy efficiencies,” said. Ms. Morrison.

“This is the first time that a multistorey, 25,000sqm commercial building in the Sydney CBD has undergone an electrification upgrade – and we’re excited to have engaged experienced mechanical air conditioning contractor Velocity Air to help deliver the project.”

Efficiencies in the new reverse cycle HVAC system will mean that hot air removed as part of the building’s air conditioning process will be recycled back into the system for use elsewhere, including heating the building’s water.

Looking long-term

Through its data informed approach, Cromwell is working focus on the broad spectrum of the ESG agenda, while prioritising the most relevant aspects. Cromwell recognises that the industry needs to remain pragmatic, but also strike a balance with a wholistic systems view.

Cromwell’s key long-term targets remain:

  • Net zero operational emissions (scope 1 & 2) by 2035.
  • Entire portfolio (scopes 1, 2, & 3) including tenant and embodied carbon by 2045.
  • Significantly reduce our gender pay gap year on year.
  • Achieve 40:40:20 gender diversity at all levels.
  • Integrate ESG into risk register and business strategy, including objectives and key results.

“Cromwell recognises the ESG challenges that the property industry faces; however, we also recognise the opportunity to deliver tangible positive impacts. The Group has a global in-house ESG team and dedicated Australian and European teams that supporting all Cromwell ESG targets and activities,” said Ms. Young.

Person typing on a laptop

Learn

Home Archives for rebeccaquade
November 29, 2023

In conversation with… Roxanne Ewing

Head of Corporate Operations, Cromwell Property Group


As one of the senior leaders within Cromwell, Roxanne has spent years helping guide the direction of the business – including fostering an environment where staff can thrive. As workplaces continue to evolve, Roxanne continues to explore how Cromwell can be a positive work environment.


1. It’s safe to say you’ve got a wide-ranging role at Cromwell, Roxanne – can you walk us through some of the key responsibilities you take on?

I do have a broad role here – and that means every day is different, which I love.

I am accountable for the People and Culture, Marketing, and Operations teams at Cromwell – so, in a nutshell, I’m responsible for ensuring that Cromwell has the right talent to execute on its strategy and deliver for our investors; execute on marketing strategies that attract and retain investors; and support the operations of the business from an office and administrative perspective.


2. You’ve been Cromwell’s Head of People and Culture in the past – and helped shape our current organisational values. How did that process come about?

Everyone has heard the old “culture eats strategy for breakfast” adage but, for me, culture eats everything; culture is everything. Without the right culture, an organisation cannot succeed – and values are at the core of that. Values are the handful of words that attempt to sum up the enormity of an organisation’s culture and vision.

It’s no secret that Cromwell has undergone a significant amount of evolution of the past few years, as all organisations do. Like any organisation, we’re not stagnant – and we had shifted significantly enough to justify redefining the terms that captured both who we were, and who we wanted to be.

And we could only achieve that by engaging everyone in the conversation. Over a three-month period, we engaged with our entire business – we asked people what our vision meant to them, who they felt we needed to be in order to achieve their best, as well as what our current strengths were that we could leverage. We also had transparent discussion about what activities we needed to stop doing.

It was a surprisingly simple process. There was general consensus about our strengths – we’re respectful, we care, we’re inclusive and we’ve got great people – as well as about those areas that we would need to focus on if we’re to achieve our vision: increased agility, collaboration, and innovation.

We solidified the values that we would live by during the next stage of our evolution as Collaborative, Progressive and Accountable.


We solidified the values that we would live by during the next stage of our evolution as Collaborative, Progressive and Accountable.
Roxanne Ewing – Head of Corporate Operations, Cromwell Property Group

3. Over the past five or six years in particular, there’s been an undeniable societal shift in attitudes on diversity and inclusion, gender equality, and cultural shifts/accepted norms. How does the ever-changing society attitude change translate into the workplace?

I think that shift started long before then, but certainly in more recent times we have seen government, regulatory bodies, talent, and the broader community really begin to hold organisations accountable for their role in diversity outcomes, as they should. Organisations, particularly large ones, have the power to make real and lasting change in this regard. And why wouldn’t they? It’s great for business.

We’re two years into our global five-year Diversity, Equity, and Inclusion journey, which has three simple goals; create a culture of respect and inclusion, foster and value diversity; and ensure equity.


4. What do you see as Cromwell’s role in the lives of our people as an employer? Is it as simple as just providing a place to work?

No, we want people to love their time at Cromwell and when they decide it’s time to move on, leave us as better people than when they joined.

For a lot of people, work significantly contributes to their meaning, their purpose, and we’re very keen to help them fulfil that. In fact, at one of our recent Leadership Summits, we focused on how we can help our people reach a state of engagement, by meeting their psychological needs – physiological, safety, belonging, esteem and self-actualisation.

At Cromwell, this encompasses providing for people’s basic needs with good remuneration, stability, and a physically and psychologically safe work environment. Creating a culture that is inclusive, allows people to bring their true self to work, and provides challenging and interesting work is critical.  It also involves giving frequent feedback and recognition and the ability for our people to continually grow and develop.  And finally, we look to give people a vision and a purpose they can connect with.

We know we play a huge part in people’s lives, and we take that very seriously. We’re far more than a place to work, we really want to help our people achieve their professional and personal purpose.


5. What operational targets has Cromwell set to improve ourself as an employer?

What gets measured, gets done – and we have plenty of targets! In the DEI space, and as part of our commitment to the Property Champions of Change Coalition, we’re using a 40:40:20 metric, a gender pay gap and a gender pay parity target to help keep ourselves accountable to our DEI Strategy.

For those that haven’t heard the term, 40:40:20 is about achieving 40% male, 40% female, and 20% other/discretionary gender representation in our workforce – we’re seeking to achieve that outcome at all levels of our organisation and we have already done so at the Executive, Senior Leader, Team Leader, and Emerging Leader levels.

Our target to reduce the gender pay gap year-on-year is an excellent measure of whether we’re achieving equality, as well as meeting our gender targets. Since setting this target, we’ve reduced our pay gap by over 20%, and we’re still making good progress.

We’ve also set ourselves an employee engagement target of 70%. Engagement is the level of emotional connection our employees have with our business and directly correlates with the level of discretionary effort they’re willing to exert. We saw a 9% increase in employee engagement over the course of 2023 and we’re hoping to keep that trend strong.

6. How has post-Covid hybrid working been addressed by Cromwell, and how are we shaping our office space to suit the needs of our workforce?

We have an ‘agile working’ approach at Cromwell. This approach dictates how and when our people work, and we recognise that agile working comes in all different shapes and sizes and will mean different things for different people and different roles.

Our people work flexible work hours, whether they be part-time, job-sharing, or simply altering their start and finish times to suit their lifestyle. It may also include different types of time-off and/or breaks from work altogether with our Career Break option. And, of course, it  pertains to location in terms to where work happens, whether that be in a Cromwell office, at an employee’s home or somewhere altogether different.

At first, we felt compelled to put all sorts of rules and guidelines around agile working, but we’ve stripped a lot of these away. Our culture is one of trust, accountability, and strong relationships between employees and their leaders. On the whole, we generally leave it to the employee and the people leader to agree an agile working approach for each individual; something that works for them.

Collaboration is one of the company values and we do love to see our people connecting and collaborating when it suits them. As a result, we’ve designed a new Brisbane office to cultivate more meaningful relationships between our teams. We’re taking up residence in one our DPF assets, 100 Creek Street. It’s a conveniently located facility with great amenities that align with what we want to offer our people.

The new office is designed specifically for our people – and around our agile working approach.  It’s designed to be light, green, comfortable, accessible and to have a space for every activity our people may want to undertake. We know that our people will work remotely when they want quiet, focused time and therefore we have put a focus on oversupplying formal and informal break out and collaboration spaces in the office. We also recognise that life doesn’t stop just because you’ve chosen to work from the office, so we have incorporated wellbeing spaces such as the wellbeing and multi-faith rooms. It’s a really exciting time for Cromwell and we can’t wait to welcome people to our new workspace in January 2024.

The new office is designed specifically for our people – and around our agile working approach.  It’s designed to be light, green, comfortable, accessible and to have a space for every activity our people may want to undertake.

7. Are there any initiatives that Cromwell has rolled out that you’re particularly proud of?

Yes! There’s too many to list here, really. I’ll focus on a few of the more recent ones.

Over the last 12 months, we have partnered with some causes that are really closed aligned with our culture, strategy and values.

This includes Relove – a charitable organisation that partners with corporate entities to rescue furniture and whitegoods and use them to furnish homes for people experiencing domestic violence or seeking asylum. As part of our participation in ‘16 Days of Activism’ against gender-based violence, we were able to help them furnish five homes as part of their 100 Homes Appeal.

Likewise, during the FIFA Women’s World Cup, we were the principal sponsor of the Moriarty Foundations’ Indigenous Footballer’s “call time on inequality” campaign. The John Morarity Football programme is Australia’s longest running, and most successful, Indigenous football initiative, with more than 2,000 Indigenous girls and boys participating.

I’m also really proud of our work in the gender equality space. We’re an active member of the Property Champions of Change Coalition, a property industry coalition working to achieve a significant and sustainable increase in the representation and equality of women in the property industry. Though we joined the charge relatively late in the game, we have made enormous headway and currently have some of the best family-friendly policies and the second lowest gender pay gap within the coalition.

And finally, I’m proud of the major cultural shift that we’ve undergone in the last 12 to 24 months. We’ve taken firm stances on our view of diversity, equity, inclusion and respect and we’ve put our money where our mouth is and significantly improved our flexibility, wellbeing, family-friendly, remuneration, and time off benefits.

8. What do you enjoy most about your role?

The fact that I get to do all the above! I have so much ability to influence the lives of our people, and those in our broader community. Absolutely every day is different, but the one thing they have all have in common is the power to make a difference, in one way or another.

I have been with Cromwell for a very long time and my role has never stagnated. I love the people that I work with in the Marketing, People and Culture and Operations teams as well as our broader Australian team and I’m inspired by what we’re here to do.

Person typing on a laptop

Learn

Home Archives for rebeccaquade
November 28, 2023

Large format retail: Sticking to the fundamentals

Colin Mackay, Research & Investment Strategy Manager, Cromwell Property Group


While most property types have experienced a performance slowdown this year on the back of rising interest rates, retail has been comparatively resilient. The sector was already being viewed with some caution pre-COVID due to the impacts of e-commerce, contributing to less substantial cap rate compression through that phase of the cycle – over the last five years, retail saw a cap rate low of 5.2% compared to 4.8% for office and 4.1% for industrial1. This different starting position has meant the negative valuation impact from cap rate expansion has been less pronounced.

The sector has also benefitted from strong fundamentals, namely strong consumption growth and a muted supply pipeline. Incomes have risen, retail spending’s share of wallet has increased, and population growth has surged. These drivers have seen Australian retail trade grow by 28% since Feb-20, with spending levels sitting 16% above the pre-COVID growth trend2.

One of Cromwell’s preferred exposures to retail is Large Format, a sub-sector that isn’t often in the limelight. These assets don’t have the scale or luxury brands of a major shopping centre. It’s a no-frills, back to basics retail proposition – but that’s not a bad thing. While underwriting assumptions do have to account for a weaker consumer outlook over the next 12 months, Large Format is expected to benefit from resilient fundamentals, offers an attractive yield and “clean” income, and is better positioned to leverage e-commerce as an opportunity rather than a challenge.

Population growth is a powerful driver of demand


Nominal retail consumption growth can be boiled down to three buckets:

  1. People paying more for the stuff they buy (retail price inflation)
  2. People buying more stuff (real growth per capita)
  3. More people buying stuff (population growth)

Of the three, population has been the most significant driver of retail growth over the last decade, averaging 1.4% p.a3. It has strengthened further post-COVID, with Australia recording population growth of +2.2% in the year to March3 and preliminary indicators of net overseas migration suggesting the pace hasn’t dropped off over the course of the year. The growth tailwind is expected to persist, with population forecast to grow by 1.4% p.a. from 2022-23 to 2032-334.


Positively for Large Format and its typical occupiers, Australia’s population growth skews to younger families. Around 60% of growth is due to net overseas migration, of which circa 80% comprises those aged under 35. This demographic is central to household formation and the retail activity that comes along with it, which is more heavily represented in Large Format assets (e.g. furniture/appliances).

Another boost to demand is the changing nature of dwelling composition. Australia is seeing the number of occupied dwellings increase faster than the population, as single person households become more common5. This has resulted in a lower average household size, or thought of another way, more dwellings required per person. While people are increasingly living in smaller dwelling types (e.g. apartments versus houses), we expect the net result to be greater demand for household goods and furnishings.


The growth of the under 35 demographic is central to household formation and the retail activity that comes along with it, which is more heavily represented in Large Format assets (e.g. furniture/appliances).

Clean income and an attractive yield


In a time of slowing growth and elevated inflation, the ability to generate stable, growing income is an important driver of investment returns. Large Format’s yield nationally is 6.1%6, higher than many commercial and residential property sectors. We also consider the yield to be “cleaner” – what you see is what you get. Compared to major shopping centres for example, which are complex structures with substantial plant and equipment, often less capital expenditure is required to maintain a Large Format asset. This means the post-capex yield, or the money that actually ends up in your pocket, may be more attractive than a simple comparison of headline yields suggests.

The income underpinning the yield also grows over time, in contrast to the fixed nature of bonds. Like the broader retail sector, Large Format leases typically stipulate rent escalation each year of 3-5% or a CPI-linked amount, usually providing growth in excess of inflation. The income stream is dependable, with the majority of Large Format income derived from 5–10-year leases to ASX-listed or national retailers, such as Bunnings, The Good Guys and Freedom.

We believe the runway for rental growth in Large Format is sustainable, given the lower starting level and attractive economics for retailers. Mosaic Brands recently announced plans to open 40 “mega stores” through to Jun-24, as the larger format is 3x more profitable than their normal store size7. For some assets, further growth can be derived from intensification – development of unutilised land, car parks, or air rights into income-generating improvements.


Omnichannel-ready


Online’s share of Australian retail trade has increased from 5.1% five years ago to 10.7% today8. The rise of e-commerce has dampened demand for physical retail space relative to household consumption, particularly across discretionary shopping centres with large exposures to categories such as clothing and department stores. Cromwell forecasts online’s share of spending to increase to 20% by 2030, however there are several reasons why Large Format can view the shift as an opportunity, given its role in omnichannel retailing.

From consumers’ perspective, Large Format minimises much of the friction associated with a traditional shopping centre experience – friction which turns shoppers towards e-commerce. Convenience is the number one reason for purchasing online9,10, as large multi-level shopping centres provide a frustrating car parking11 and navigation experience. In contrast, Large Format assets are often a simple rectangular layout with large on grade or basement car parks. These assets can provide the benefits of a physical shopping experience, such as better customer service8 and the ability to touch and trial products12, while minimising the painpoints. In-person shopping is particularly valued across Large Format’s typical retail categories such as homewares and home improvement.

For retailers, Large Format facilitates an improved omnichannel proposition in a number of ways. Rents are typically in the range of $300-600 per square metre, much lower than traditional shopping centres and closer to levels being seen across industrial assets today. Sites are generally large, flat, and designed to be accessible to the heavy vehicles delivering bulky goods to occupiers. Assets are also often well-located, with ample arterial and motorway connections servicing significant population catchments. These attributes make Large Format assets well suited to the full suite of omnichannel product “delivery” options, including buying in store, click and collect, and ship from store, while also offering reasonably cost-effective inventory storage – Nick Scali for example stores 55% of inventory in its showrooms13. In this respect, Large Format can offer investors a quasi-industrial exposure spanning warehousing and fulfilment, with the added fillip of revenue generation (making sales).

The physical store presence also aids in reducing last mile reverse logistics costs14 and processing times15, and provides retailers with an additional opportunity to engage with customers and generate a sale when products are being returned. By offering a seamless omnichannel experience, retailers can drive customer engagement and loyalty.

Customers’ preference for omnichannel is evidenced in trading outcomes, with “Bricks & Clicks” retailers winning online market share at the expense of “Digital Native” retailers16, and multichannel customers spending 2-3x more than single channel customers17. Omnichannel is important to customers and retailers alike, and Large Format’s characteristics can make it a preferred component in that proposition, particularly as e-commerce increases its share of sales and industrial rents reach higher levels.

Large Format is an omnichannel hybrid of retail and industrial, offering consumers a “touch and trial” shopping experience and retailers a cost-effective shopfront and inventory storage.

Supply is constrained, good news for existing owners


One of the reasons retail in Australia has avoided the “dead mall” phenomenon seen in the US is sensible planning policy and constructive relationships between developers and councils. In the US, developers have taken advantage of lax policy to build more than double the shopping centre floorspace per capita than Australia18, causing supply to considerably outstrip demand and leading to significant space handbacks and store closures. Australia, by comparison, has restricted development to more sustainable levels, raising barriers to entry and lowering the likelihood of value-destroying competition impacts for both landlords and retailers. While there are more land zones where Large Format is permissible compared to traditional shopping centres, the lack of excess shopping centre space more broadly means a better supply-demand balance across the whole spectrum of retail typologies.

In addition to the above, Large Format supply has been constrained more than normal by rising construction costs, labour and material shortages, and a lack of suitable sites, exacerbated by competition from industrial uses. The characteristics which make a site compelling for Large Format (size/configuration/access/location) are also desirable to industrial facilities. With industrial vacancy below 1%19 and yields remaining tighter than other sectors1, developers are prioritising industrial over other uses such as Large Format. A recent example is Goodman’s 2022 acquisition of Alexandria Homemaker Centre with the intention of future conversion to logistics, which will result in the withdrawal of Large Format space from the market (a positive for existing asset owners). Such transactions also highlight how Large Format centres can be used as a way to land bank large sites in tightly held corridors, with the benefit of income generation over the hold period.

Large Format Outlook


The outlook for demand is robust with retailers continuing to look for space – Super Retail Group for example is looking to open an additional 61 stores by Jun-26, while the likes of Baby Bunting, Bedshed, Nick Scali and Plush require a combined 125+ locations to reach their target store networks20. The vacancy rate has tightened to 3.2%21, its lowest level since at least Jun-17, meaning limited space is currently available and future availability will be constrained by the muted supply pipeline. These dynamics are expected to create conditions conducive to rental growth, which CBRE forecasts will run at +3.0% p.a. nationally from 2023 to 202622.

Stock selection is key, with Large Format performance closely linked to location, the strength of the surrounding catchment (i.e. income/population growth), and impacts from competition. Metropolitan sites in land-poor markets are preferred given the protection that scarcity (and lack of competition) provides to valuations over time – acquiring at attractive pricing is a key challenge for these types of assets. Dominant assets in fast-growing non-metropolitan markets can also be attractive if the risk of future competition can be adequately priced.


  1. The Property Council of Australia/MSCI Australia Annual Property Index, MSCI (Jun-23)
  2. Retail Trade August 2023, ABS (Sep-23)
  3. Based on analysis by the Centre for Population, National population projections in the 2023-24 Budget; Cromwell (May-23)
  4. National, state and territory population, ABS (Sep-23)
  5. ABS 2021 Census; Cromwell
  6. Australian Retail Figures Quarterly Market Report, 2Q 2023 (CBRE)
  7. FY2023 Market Update, Mosaic Brands (Aug-23)
  8. Rolling 12-month basis as at Jul-23. ABS Retail Trade (Aug-23)
  9. IAB Australia and Pureprofile Australian Ecommerce Report 2023
  10. Shopping Pulse, Klarna (Q2 2023)
  11. Bricks & Clicks, UBS (2019)
  12. Retail Monitor, Australian Consumer and Retail Studies, Monash Business School (Nov-22)
  13. FY23 Results Presentation, Nick Scali (Aug-23)
  14. Wallenburg, Einmahl, Lee & Rao (2021)
  15. McKinsey (2021)
  16. Inside Australian Online Shopping, Australia Post (2023)
  17. Myer (Sep-23); Coles (Feb-21); Accent Group (Aug-18); Pallant et al (2020); KPMG (Dec-22)
  18. SCCA (Sep-23)
  19. Australian Industrial and Logistics Figures Q2 2023, CBRE (Jul-23)
  20. Company reports; Cromwell (Sep-23)
  21. JLL Research (Jun-23)
  22. Large Format Retail Australia, CBRE (May-23); Cromwell. Rental growth refers to Prime net face rents (AUD/sqm).

Register your interest

From time to time, Cromwell Funds Management may launch new investment opportunities. To opt in to hearing about these opportunities, fill out the form below.

All personal information submitted will be treated in accordance with our Australian Privacy Policy. By submitting personal data to Cromwell Funds Management, you agree that, where it is permitted by law and in accordance with our Australian Privacy Policy or where you have agreed to receive communications from us, Cromwell Funds Management may use this information to notify you of our products and services and seek your feedback on our products and services. Please note you can manually opt out of any communications.

Person typing on a laptop

Learn

Home Archives for rebeccaquade
October 11, 2023

Redefining the office flight to quality: A Sydney CBD case study

Colin Mackay, Research & Investment Strategy Manager, Cromwell Property Group


“Flight to quality” has been the real estate industry’s phrase of the year, particularly as it pertains to the office sector. While Cromwell agrees that a flight to quality is occurring and will continue to play out over the medium-term, our opinion of what that flight actually is – and indeed our definition of quality – is somewhat contrarian.

Quality has become synonymous with Premium – the top grade of office buildings. These buildings are modern developments with the largest floorplates, most internal amenity, and luxurious finishes and fitouts – and which naturally charge the highest rents. While this type of asset is an important part of the market, it’s worth assessing whether the popular narrative fits all the facts.

Are occupiers flocking to Premium assets at the expense of Secondary stock? Does the top-end of town hold all the cards?

Net absorption is important but doesn’t tell the whole story


Net absorption is the metric often cited as evidence of the flight to (Premium) quality. In the Sydney CBD, Premium stock has recorded the strongest net absorption over the last 20 years at around +624,000 square metres (sqm), an increase in occupied stock of +137%. A Grade’s net absorption (+270k sqm) has been the second strongest over that time period, with the amount of occupied space increasing +18%. On face value, it’s easy to see why the “Premium is best” narrative has emerged – but there’s more to the story!

Premium has also seen the largest increase in total space.


Net absorption is the change in occupied (leased) space over a given period (often a quarter or year), represented in square metres. It is calculated by subtracting the amount of occupied space at the start of a period from the amount of occupied space at the end of a period. Positive net absorption means the amount of occupied space has increased, while negative net absorption represents a decrease.


Growth in occupied space is an expected by-product of the substantial increase in supply. On the other side of the coin, B Grade has recorded negative net absorption but also a decrease in total space – occupiers can’t lease space that doesn’t exist.

This dynamic is often seen in the lower grades as buildings are “withdrawn” (removed) from the market through conversion to different uses (e.g. residential). When we consider that rents are a function of demand and supply, it becomes clear that looking only at net absorption provides an incomplete picture of market conditions – we also need to look at the supply side of the equation.

On face value, it’s easy to see why the “Premium is best” narrative has emerged – but there’s more to the story!

Vacancy paints a different picture


Vacancy rates highlight a deterioration of demand relative to supply at the top end of the asset grade spectrum. In the Sydney CBD, Premium has the highest vacancy rate in absolute terms and when compared to its historical average.

B Grade has proven more resilient from an occupancy perspective, with vacancy actually decreasing over the last year.


Despite elevated vacancy, Premium’s net effective rental growth has outpaced A Grade and B Grade over recent quarters. There are a couple of potential explanations for this counterintuitive result.

Time lags: It takes time for changing conditions to be grasped by market participants, for negotiations to be had and leases signed. Premium had the lowest vacancy rate until mid-2022, with its main occupiers adopting a “wait-and-see” approach to space decisions through the pandemic. Now, Premium occupiers are handing back space and driving vacancy higher, but current rental outcomes are reflecting the tight conditions of prior quarters.

Affordability: The spread between Premium and A Grade rents narrowed over 2021-22 as Premium incentives increased. Industry feedback suggests occupiers have taken advantage of the relative affordability to upgrade, taking up less space but at a higher rate per sqm. This is positive for market rental growth but less so for income growth, given the occupancy effect. We expect Premium upgrading to run out of steam as affordability worsens, with the spread recently increasing to its widest level since 2014.


Incentives are financial ‘sweeteners’ offered by landlords to encourage tenants to lease space. Common incentives include contributions to tenant fitout costs, rent-free periods, and rental abatements where the amount payable is reduced for a period of time. The rent received by a landlord after incentives are accounted for is referred to as an “effective” amount.


In any case, for investors, there’s limited value in knowing today’s performance – what really matters is the future.

Good things come in small packages


In our view, it will be difficult for Premium stock to maintain the current pace of rental growth, with A Grade stock likely to outperform over the medium-term due to lower vacancy, a less substantial supply pipeline, and favourable occupier trends.

Cromwell estimates there are 265k sqm of Premium space in the Sydney CBD which will need to be leased in the near term based on space currently vacant or completing by the end of 2024. This “baked in” amount is equivalent to 19.7% of current Premium stock. Future developments may deliver new supply to the market post-2024, however we only consider 43k sqm as highly likely on a probability-adjusted basis.

A Grade has a larger amount of space requiring leasing (403k sqm); however, it is smaller as a proportion of existing stock (18.8%). Unlike excess B Grade stock which may be withdrawn from the market via change of use, the only feasible option for Premium space is absorption via leasing. On this front, the Premium end of the market faces some challenges.

Space contraction impacts from work-from-home are being felt most keenly by assets with large floorplates. These buildings are expensive to divide into smaller tenancies and typically cater to the largest occupiers. Research1 points to an inverse relationship between occupier size and office usage, which is then being reflected in organisations’ plans to expand or contract their office footprint. The industries that predominantly occupy Premium buildings (financial services, professional services, tech) also demonstrate a lower propensity to use the office post-COVID.

Australian leasing data corroborates the research findings. Net absorption has been far stronger across smaller (<1,000sqm) occupiers than large occupiers. The tendency to expand has also been far more positive, with smaller occupiers on average expanding their footprint by ~20% (national leasing deals from 1Q21 to 2Q22) compared to an average contraction of ~13% for occupiers larger than 3,000sqm2.

We believe the in-office bias of smaller occupiers versus larger occupiers reflects the nature of work typical across these organisations. Bigger firms are more regimented and siloed, with large administrative “back office” functions that predominantly perform focused tasks individually. These firms may have also invested more heavily in digital collaboration tools which facilitate remote work across a more geographically dispersed workforce. Smaller firms are more dynamic, with employees wearing multiple hats and undertaking work that tends to favour face-to-face interactions. Regarding smaller firms’ space expansion, this may be linked to their much stronger headcount growth through the pandemic. Businesses with 5-199 employees saw employment growth across the main office-using industries of 4.6% p.a. from Jun-19 to Jun-22, compared to -0.2% p.a. for businesses with 200+ employees3.


One of the arguments often made against exposure to smaller occupiers is that they are riskier than large occupiers, but the data shows this isn’t the case. While very small firms do fall over more often, those with 20-199 employees have nearly identical survival rates to firms with 200+ employees. The smaller occupier bracket is also broader and more diversified, with office-using businesses spanning many industries. By comparison, the large firm bracket is dominated by financial and professional services. Overexposure to large occupiers can also increase the risk that a significant portion of an asset becomes vacant at a single point in time, rather than being spread over a manageable leasing horizon.

Price doesn’t always equal quality


Conflating luxury with quality ignores the needs of many office occupiers. While the largest companies attract the most attention, most office-using Australian businesses are small and medium-sized enterprises (SMEs)4. With cost being the top driver of real estate decisions5, these SMEs are in the market for a Toyota, not a Rolls-Royce with all the extras. They want the highest quality office, in the best location, but within their price bracket. So then, what is “high quality” office? Ultimately, it’s space which meets the needs and preferences of its target occupiers.

Some occupier preferences are timeless and will persist no matter how workstyles and space usage evolve, for example availability of natural light, convenient access to transport and plenty of nearby amenity (e.g. dining and gyms). These are hygiene factors valued by occupiers of any industry or size.

The pandemic has rendered some requirements less important. Floorplate size has historically been a measure of quality and is one of the criteria that determines whether a building is considered Premium or a lower grade. But with occupiers’ office usage shifting towards collaboration and social connectivity, a smaller floorplate can create more incidental interactions and a better ‘buzz’ in the office. While there is a minimum viable size in terms of efficiency and layout, we’re finding bigger isn’t always better in the eyes of occupiers.

Other requirements have increased in importance as occupiers shift to a new way of working. A greater level of embedded technology is expected, to ensure a flexible working model can be facilitated. Greater diversity of spaces is needed to support focused work, collaboration, and flexibility, with implications for building layouts and landlord-led fitouts.

Sustainability also continues to increase in importance, with a wider array of organisations focusing on both the financial and social benefits it can provide, including staff attraction and retention.

Greater diversity of spaces is needed to support focused work, collaboration, and flexibility, with implications for building layouts and landlord-led fitouts.

Not always the more sustainable choice


The preference for sustainable space is becoming more tangible and spans a variety of stakeholders, including end users, occupiers, and investors. Premium buildings often have the highest sustainability ratings (e.g. NABERS), something which is used to support the view that occupiers will increasingly gravitate to these assets over time. But again, these ratings don’t tell the whole story.

While new Premium assets are top performers from an operational emissions perspective (e.g. energy usage), production of building materials and construction activities are the largest producers of embodied carbon emissions6. As the grid decarbonises, embodied carbon’s share of built environment emissions is expected to increase from 16% in 2019 to 85% by 20506 – in the pursuit of net zero, minimising the demolition of existing buildings and the construction of new ones will become far more important than building-specific energy efficiency. As the importance of embodied carbon becomes more well known and stakeholders adopt a whole-of-life view of emissions, newly built Premium assets may not be considered the greener option.


Embodied carbon: the emissions generated during the manufacture, construction, maintenance and demolition of buildings – Green Building Council of Australia (GBCA)


Is this only a Sydney theme?

While this paper has focused on the Sydney CBD for simplicity and brevity, we see the same dynamics playing out in Melbourne. The CBD Premium vacancy rate is almost 19%, and Cromwell forecasts the amount of Premium stock will increase by 15% by 2026 based on new supply currently under construction. The same occupier trends are also occurring, with small occupiers recording positive net absorption of over +23k sqm since Dec-19, compared to negative net absorption of almost -241k sqm for large occupiers.

We believe the flight to quality is occurring across all grades – not just Premium – as occupiers seek space that is well-located, offers high amenity, and enables a flexible approach to working, but within their price bracket.

Look beyond the headline


“Flight to quality” has been a popular theme in the office sector. While positive net absorption has been used to support the notion that Premium buildings are outperforming lower grade assets, the metric can’t be looked at in isolation. Investors gain a more comprehensive understanding of market conditions by also considering other factors such as vacancy, supply impacts and occupier demand trends. We believe the flight to quality is occurring across all grades – not just Premium – as occupiers seek space that is well-located, offers high amenity, and enables a flexible approach to working, but within their price bracket. In our view, the A Grade segment of the market is best-positioned as it occupies an affordability-quality sweet spot, supported by ongoing demand from smaller occupiers and a smaller supply pipeline.


  1. Empty spaces and hybrid places (McKinsey, Jul-23); U.S. Office Occupier Sentiment Survey (CBRE, May-23)
  2. Australian Office Footprint Analysis (CBRE, Oct-22)
  3. ABS (May-23); Cromwell. Main office-using industries includes: Information media and telecommunications; Rental, hiring and real estate services; Professional, scientific and technical services; Administrative and support services; Education and training (private). Financial services employment breakdown is not published by the ABS.
  4. SMEs defined as businesses with 5-199 employees, within the same office-using industries as previously defined.
  5. What Occupiers Want (Cushman & Wakefield, Jul-23)
  6. Embodied Carbon & Embodied Energy in Australia’s Buildings (GBCA; thinkstep-anz, Aug-21)