21341
Person typing on a laptop

Learn

Home Archives for brunoconsiglio
October 28, 2024

September 2024 direct property market update

Economy1

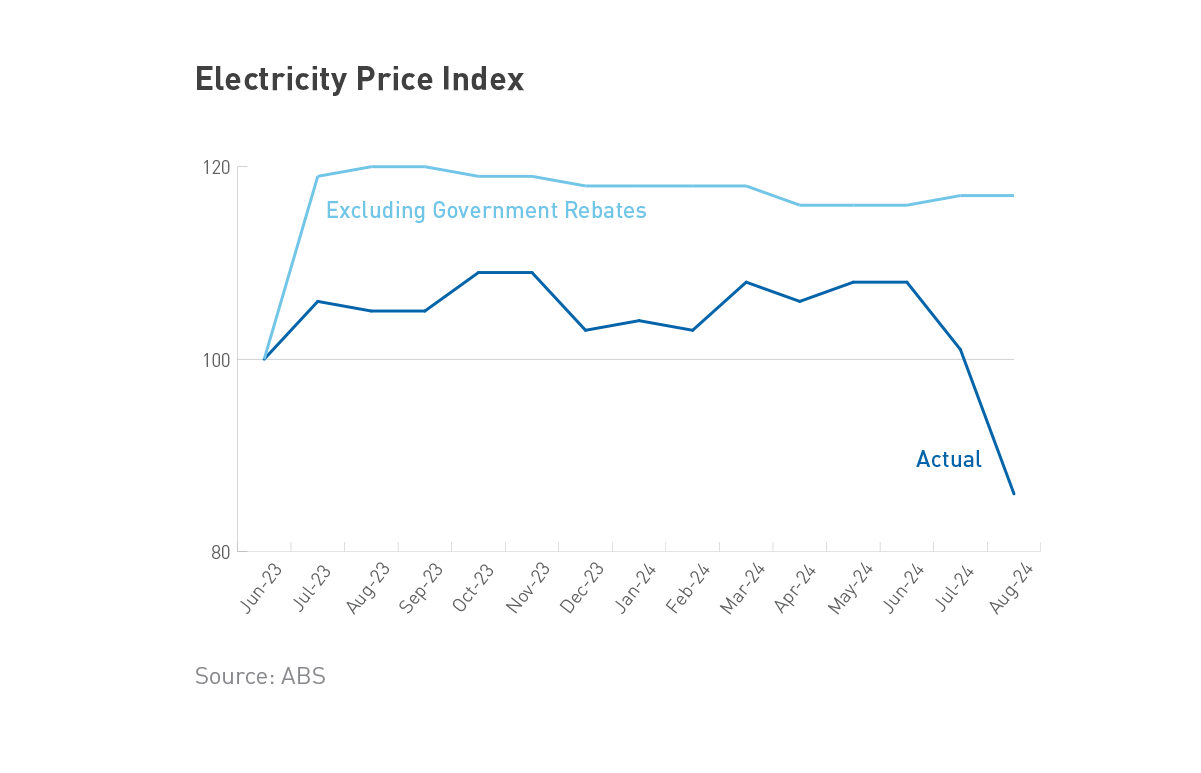
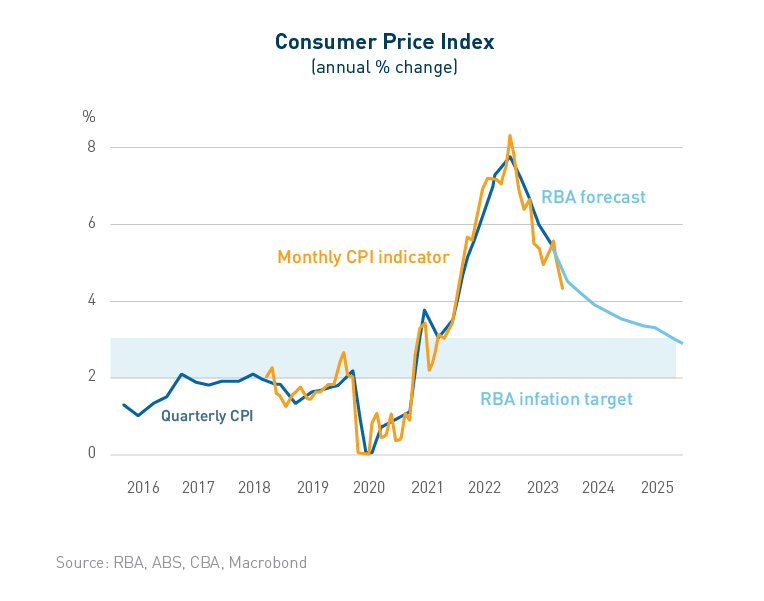
The trajectory of inflation – and consequently interest rates – remains top of mind for financial markets, businesses, and households alike. Year-on-year headline inflation of 2.7% was recorded in the month of August, a substantial fall from the 3.5% rise recorded in July and the first time the measure has sat within the RBA’s target band of 2-3% since 2021. However, the sharp fall was in part due to Federal and State Government cost-of-living subsidies, namely electricity rebates. The RBA is “looking through” these temporary factors and instead focusing on underlying inflation, which continued to slow in August but was a more elevated 3.4% year-on-year (per the trimmed mean).

The RBA has maintained its cautious stance, making it clear that its focus is on getting inflation sustainably within the target range. Any decisions to cut the official cash rate will be made with that objective top-of-mind. While some banks are still noting the possibility of a rate cut at one of the two remaining meetings this year, consensus points to the first cut occurring in February next year, with several cuts expected by December 2025 . Lower interest rates should boost market confidence, stimulate transaction activity, and support property prices.

chart_electricitypriceindex

One of the key data points influencing the RBA’s monetary policy decisions – besides inflation – is the strength of the labour market. Employment has proven resilient, with jobs growth of 47,500 recorded in August. Similarly, the unemployment rate remained at 4.2%, having only increased by +0.3% since the start of the year. While these and other metrics indicate a robust labour market, it is important to highlight that not all industries are experiencing the same conditions. One of the more obvious divergences exists between industries exposed to the business cycle and consumers (market industries), and non-market industries such as healthcare and education. Data released in September indicates non-market industries accounted for 89% of jobs created over the 12 months to June. This poses a challenge for the RBA, which would like to see some heat come out of the labour market overall, but whose blunt tool has more of an impact on the industries and sectors which have already slowed.

Another important driver of the economy being closely watched is household consumption and how it responds to the stage 3 tax cuts which kicked in this quarter. While it’s too early to get a firm read on consumers’ response, initial indications suggest a greater propensity to save than spend. CommBank’s analysis of their proprietary data shows while incomes have increased following the tax cuts, card spending has not seen a similar lift. Instead, consumers are saving the additional cash flow by boosting offset and redraw account balances. The CommBank data was broadly corroborated by the ABS Household Spending Indicator for August, which showed spending -0.5% lower than June levels. While the retail component of household consumption exceeded expectations in August (+3.1% YoY) and should be supported by the tax cuts, a sustained recovery may take some time (and rate cuts) to materialise.

chart_incomevsspending


chart_additionalrepayments

Office

It was an improved quarter for office space fundamentals, but the headline figures continued to obscure varied performance across markets. Analysis of JLL Research data indicates over 90,000 square metres (sqm) of positive net absorption (demand) was recorded across the major CBD markets in aggregate, the strongest quarter since 3Q18. Most of the demand expansion was driven by Sydney CBD which recorded its strongest result since 2015, with support from Canberra and Adelaide CBD. Melbourne CBD was again the weakest performing market from a demand perspective, dragged into contraction by the western end of the city.

chart_netabsorption_YoY

With limited new supply completed over the quarter and the demand side of the equation proving solid, the national CBD vacancy rate improved from 15.4% to 15.1%. Every market except Melbourne CBD and Brisbane CBD saw vacancy decline, with Sydney CBD (-0.9%) the standout due to its strong quarter of demand. Canberra and Brisbane CBD remained the tightest markets – their vacancy rates are in line with or tighter than the long-term average.

chart_totalvacancyrate

The pace of prime net face rent growth (+1.3%) improved over the quarter, taking national CBD annual growth to +4.7% (from +3.9% last quarter). Reflecting its favourable supply-demand conditions, Brisbane CBD was again the standout market recording growth of +2.8% (QoQ). Pleasingly, there were also material improvements in face rental growth for Canberra and Sydney CBD, with Canberra delivering its strongest quarterly result since 2012. Incentives were relatively unchanged with the exception of Melbourne CBD, which worsened. This resulted in positive net effective rental growth outcomes, particularly in Sydney CBD which recorded its strongest quarter of effective growth since 2017.


chart_primeneteffectiverentalgrowth

While transaction activity slowed in dollar terms compared to last quarter ($2.1b vs $2.7b), the number of deals done increased. It was the absence of any ‘mega’ deals which dragged the volume figure, with the largest transaction this quarter – Billbergia’s estimated $500m acquisition of Han’s Group’s Sydney Pitt St development site – dwarfed by last quarter’s 55 Pitt St stake selldown. The Melbourne and Sydney CBDs were the most active markets comprising 71% of dollar volume, well above their average share over the last ten years of less than 50%. Across the major CBD markets, average prime yields were largely unchanged with only Sydney CBD seeing a negligible softening. This was only the second quarter since market pricing peaked approximately two years ago where national CBD yields expanded by less than 15bps.

Retail

It was a very strong quarter for retail with the core sectors (Regionals/Sub-Regionals/Neighbourhoods) recording weighted net rent growth of +0.7% compared to June. This was the best quarterly result since 2010, in aggregate and for each sub-sector. Regional centres stood tallest delivering growth of +0.9% (QoQ), but the outcomes across Sub-Regionals and Neighbourhoods were also healthy. From a market perspective it was the East Coast which outperformed. South-East Queensland recorded the strongest core retail growth for the second consecutive quarter, with growth in every sub-sector exceeding +1.0% and the convenience end of the centre type spectrum (Sub-Regionals and Neighbourhoods) performing particularly well. Sydney and Melbourne also recorded solid growth while Adelaide and Perth were unchanged across the board. Rental growth has been supported by a lack of supply, with stock growth running well below population growth over the last two years.

chart_netrent_QoQ

Transaction activity continued to improve, with September dollar volumes totalling $1.9b and exceeding the $1.8b recorded last quarter. The total was buoyed by Vicinity’s $420m acquisition of the Future Fund’s 50% stake in Lakeside Joondalup – a major shopping centre in Perth – in what was the largest deal in a year. Two other Regionals also changed hands in Perth during the quarter, resulting in the highest transaction volume on record for Western Australia. Yields were largely unchanged except for Sydney Neighbourhoods, which recorded 12.5bps of compression. This represents the second quarter of no movement for most centre types and markets, potentially signalling retail asset pricing is starting to stabilise.

Industrial

Occupier take-up (gross demand) increased on last quarter to total nearly 820k sqm, which is in line with the quarterly average of the past five years. Multiple industries recorded weaker take-up with Manufacturing and Construction (a notably volatile industry) being the main drags. These industries were more than offset by solid growth across Transport & Warehousing, Wholesale Trade, and various smaller tenant industries. The major driver of improved take-up was Brisbane, which recorded its strongest quarter since last year. Adelaide and Perth also recorded solid growth while Sydney and Melbourne were relative drags.

chart_occupiertakeup

Rental growth remains above the long-term average despite a weakening of demand relative to supply. The quarterly pace of rental growth slowed across the East Coast but improved in Perth and Adelaide. Perth recorded a sharp acceleration across all three of its precincts, while Adelaide was the top performing market over the quarter, led by rents in the Outer South growing by more than 6%. Melbourne prime rents were unchanged across the board, while Brisbane and Sydney outcomes were mixed – precincts that outperformed in the previous quarter slowed, while those which underperformed saw an acceleration this quarter. Incentives increased in Brisbane, Perth and most Sydney precincts, impacting effective rental growth.

Delivery of supply moderated compared to last quarter but remained elevated versus historical averages, with nearly 750k sqm of new stock completed over the three months to September. Melbourne recorded very little supply after a record level of completions last quarter, outpacing only the much smaller markets of Perth and Adelaide. Supply continues to be concentrated in a small number of precincts, with a single Sydney precinct (Outer Central West) accounting for more than half of new supply over the quarter. There are currently over 2 million sqm of floorspace under construction and largely due for completion in 2024 and 2025. While extended delivery schedules and solid pre-commitment levels are helping prevent a surge of unleased supply from entering the market, the elevated pipeline of projects will likely continue to push the vacancy rate upwards and dampen the pace of rental growth.

It was a solid quarter of transaction activity with dollar volumes totalling $2.1b. While Sydney activity fell after three consecutive $1b+ quarters, Melbourne recorded its strongest quarter in history. The result was underpinned by the $600m acquisition of the Austrak Business Park in Melbourne’s north, which Aware Super and Barings jointly secured. Yields across every Perth precinct expanded by 25bps, the only movement recorded over the quarter.

Interest rate expectations will remain a key influence on the performance of commercial property. We believe rate cuts will contribute to improved market confidence, support a stabilisation of pricing, and stimulate transaction activity.


Outlook

Global issues are expected to dominate the headlines over the coming quarter. From an economic perspective, escalating conflict in the Middle East may put upwards pressure on oil prices and hence headline inflation. However, the potential impact on underlying inflation is less clear. While consumers would notice some pain at the bowser, higher fuel prices could dampen demand across the economy more broadly. As Australia’s largest export market, the impact of economic stimulus in China will also be closely watched. Announcements to date appear unlikely to move the needle significantly, but there is scope for additional policies to be delivered. Finally, the outcome of the election and key data prints (jobs and CPI) in the US could materially shift interest rate expectations and financial conditions in Australia.

Interest rate expectations will remain a key influence on the performance of commercial property. We believe rate cuts will contribute to improved market confidence, support a stabilisation of pricing, and stimulate transaction activity. Other countries such as the US, Canada, New Zealand, and several across Europe, have already started lowering rates. Australia’s inflation cycle took hold around six months later than peer markets, and rate cuts are also expected to commence a bit later. A consensus is starting to form across economists, with February being pencilled in for the first rate cut by three of the four major banks. However, it is important to note that the precise timing is uncertain and will be data dependent.

How did the Cromwell Funds Management fare this quarter?

In late August, Cromwell Direct Property Fund completed the sale of 433 Boundary Street, Spring Hill, at a 3.8% premium to its most recent external valuation of $40.0 million. The net proceeds from the sale were used to repay debt, reducing the fund’s gearing.

In September, Cromwell Funds Management revalued approximately 28% of the fund’s portfolio, resulting in an overall decrease in value of 2.2%. As at 30 September 2024, the portfolio is valued at $554.6 million, with a weighted average capitalisation rate of 7.24%. Despite continued strong growth in rents and increased tenant demand, recent sales evidence has contributed to further cap rate expansion. Major sales in the Brisbane CBD this quarter include the William Buck Centre at 120 Edward Street, and 116 Adelaide Street.

Despite this, the outlook for both Brisbane’s CBD and fringe office markets remains positive. Market commentary suggests that while there will likely be some further downward pressure on valuations through the remainder of 2024, yields are finally nearing the bottom of the cycle.

Additionally, new interest rate hedging has been executed this quarter to provide certainty around the fund’s largest cost – its interest expense. The fund is now 58% hedged, with a weighted average hedge term of 2.4 years. Variations in interest expense can have a material impact on operating earnings, so minimising the downside risk associated with those movements through the use of interest rate derivatives helps maintain the fund’s ability to consistently deliver monthly distributions to investors.

Cromwell’s Projects Team remains hard at work on major capex updates, including the finalisation of lift modernisation at 100 Creek Street in Brisbane. This work involves upgrading the equipment and controls for the building’s eight lifts. The team is also in the procurement stage for installing a new heating plant at Creek Street.

At the O’Riordan Street asset in Mascot, a new bracketing system is being installed to secure the car park façade panels, with the project currently in the engineering design and development phase. Additionally, the team is progressing with the design for the lobby and end-of-trip facilities, which will enhance the tenant experience and support lease renewals.

At the 420 Flinders Street asset in Townsville, Cromwell continues investigations with engineers into some remediation works on the wet wall. This proactive effort aims to address issues with the shoring wall construction and prevent potential water infiltration. Due to limited access for repairs, this is a complex project, with testing underway to guide the next steps.

CromwellConnect, the new tenant platform, has been successfully rolled out and has been incredibly well received by tenants at Creek Street. The online platform and mobile app allow tenants to stay updated on the latest building news, book meeting rooms, join health and wellbeing sessions, and access local retail offers.

Annual tenant engagement surveys have been completed, with results expected later this month. The information will be included in our annual ESG report, which was released at the end of October.
Encouragingly, data from the fund’s Altitude Corporate Centre in Mascot shows an 18% reduction in base building electricity consumption over July and August this year, while our Flinders Street property in Townsville saw a 14% reduction. These results are thanks to the newly installed solar infrastructure.

The fund’s portfolio currently stands at 95% occupancy, with a weighted average lease expiry of 3.7 years. However, there are leasing deals currently under Heads of Agreement – the stage where terms have been agreed but lease documentation is not yet executed. Accounting for the largest of these agreements – a new seven-year deal across more than 2,100sqm at 545 Queen Street, Brisbane – occupancy improves to 97%.

Across the eight-asset portfolio, there is now only three floors available for lease – one each at Creek and Queen Streets in Brisbane, and one at 95 Grenfell Street in Adelaide.

Read more about the Cromwell Direct Property Fund: www.cromwell.com.au/dpf.

Past performance is not a reliable indicator of future performance.

Cromwell Funds Management Limited ACN 114 782 777 is the responsible entity of and issuer of units in the Cromwell Direct Property Fund ARSN 165 011 905.

Before making an investment decision in relation to the Fund it is important that you read and consider the Product Disclosure Statement and Target Market Determination available from www.cromwell.com.au/dpf, by calling 1300 268 078 or emailing invest@cromwell.com.au.


  1. Data sourced from various ABS publications, except where otherwise specified.
About Cromwell Direct Property Fund

Read more about Cromwell Direct Property Fund, including where to locate the product disclosure statement (PDS) and target market determination (TMD). Investors should consider the PDS and TMD in deciding whether to acquire, or to continue to hold units in the Fund.

Person typing on a laptop

Learn

Home Archives for brunoconsiglio
September 25, 2024

What’s in a Cap Rate

Stuart Cartledge, Managing Director of Phoenix Portfolios


Capitalisation rates, commonly known as “cap rates”, are a fundamental metric in Australian property investing. When a commercial property is sold, two pieces of information will be widely reported. Firstly, the amount the property sold for and secondly, the cap rate. Often properties will be compared by their respective cap rates. Reports will often comment on the “implied cap rates” of different property securities. However, this seemingly simple and ubiquitous measure can be far more complex to use when comparing different types of properties.

What is and isn’t in a cap rate

Whilst different market participants may mean different things when referring to a cap rate, the Property Council of Australia (PCA) defines a cap rate as a property’s net operating income (NOI) divided by its property value estimate. For example, if a property generates an annual NOI of $500,000 and is valued at $10 million, the cap rate would be 5%. A purchaser might assume that they would receive a cash flow yield of 5% plus any rental growth that may occur. This isn’t necessarily the case and ignores key considerations.
 

Capital Expenditure (Capex):

Commonly, properties require meaningful ongoing investment, which isn’t reflected in the NOI used to calculate cap rates. This investment is known as capex and comes in many different forms. It may be maintenance capex, which refers to significant replacements or additions to maintain the standard of an existing building. For office properties, this may include replacing lifts or air conditioning units, each of which may need a full replacement as often as every 15 years. For shopping centre properties, capex may include items such as escalators or shared facilities such as bathrooms. Maintenance capex is not directly reflected in increased rent and is commonly used to “maintain” the relevance of an existing building. This amount is often referred to as a percentage of a building’s value. For example, if a building worth $100 million requires maintenance capex of $500,000 per year, it is common to say it requires 0.5% (or 50 basis points) of maintenance capex.
 

Leasing Incentives:

To attract and retain tenants, commercial property owners often provide “incentives” to prospective and renewing tenants. These incentives can take many forms, but are commonly provided as rent-free periods, or contributions to a tenant’s fit-out. The size and form of incentives varies greatly between different property types. Incentives are commonly quoted as a percentage of the total rent to be paid over the tenant’s lease period. For example, if a tenant agrees to a 10 year lease for $100,000 per year, a 20% incentive would mean that $200,000 of benefits are provided to the tenant. Rent, less any incentives is called “effective rent” and in the above example effective rent would be $80,000 per year. Rent excluding incentives is called “face rent”. It is typically face rent that is used to calculate the NOI used in a cap rate.

Whilst not the subject of this article, it is worth noting that lease structures including term and rent reviews, as well as tenant quality are not considered in a cap rate. Buildings with longer leases, higher fixed rent increases and better tenant quality tend to attract lower cap rates than the alternative.

Now and then

In a past generation, institutional grade commercial property primarily consisted of office, retail and industrial property. Approximate leasing incentive and maintenance capex amounts across these subsectors 15 years ago can be seen in the table below:

Property Type A Grade Melbourne CBD Office Building A Grade Melbourne Shopping Mall Modern Melbourne Industrial Facility
Leasing Incentives 20% 0% 5%
Maintenance Capex 0.5% 0.5% 0.3%

Whilst there are some differences between the amount of cash flow leakage, the difference between property types is not enormous. Whilst industrial properties faced limited cash flow leakages, market rental growth had been extremely low for a long period. It may not have been perfect but comparing cap rates across these property types 15 years ago was not a terrible way to assess relative value.

Beyond any changes to leasing incentives and maintenance capex requirements, today’s listed property sector is much broader than it used to be. Alternative property types such as healthcare, social infrastructure, petrol stations and long WALE sale-and-leaseback properties are all part of the institutional investment landscape. Many of these property types are commonly leased in an owner favourable “triple-net” manner. A triple-net lease means a tenant is responsible for property taxes, building insurance and maintenance capital expenditure across the life of the lease.

A revised table approximating today’s leasing incentives and maintenance capex, including triple-net properties, can be seen below:

Property Type A Grade Melbourne CBD Office Building A Grade Melbourne Shopping Mall Modern Melbourne Industrial Facility Triple-net Property
Leasing Incentives 42.5% 15% 10% 0%
Maintenance Capex 0.6% 0.6% 0.3% 0%

Mind the Gap

It is clear when comparing the above tables, that the dispersion in incentives and capex has widened materially. In the case of an A grade office building, the gap between the building’s cap rate and its true cash flow yield is vast. The chart below demonstrates this visually for an office building with a 6% cap rate:

Mind-the-gap-graph-1

As can be seen, the cap rate in no way resembles the true cash flow of owning an office building, with more than half of the NOI received (used in calculating the cap rate) lost to capex and incentives.

Consider the four assets in the above table. In this example, each has a cap rate of 6%. The chart below shows the cash flow yield of each:

Mind-the-gap-graph-2


What to do?

Phoenix actively considers the factors affecting cash flows (among others) and explicitly forecasts longer term capex and incentives that property owners will be required to pay. It is these cashflows that determine value, not next year’s dividend or simply observing a cap rate.

A comparison of Dexus (DXS) and Charter Hall Social Infrastructure REIT (CQE) shows the importance of looking beyond headline cap rates and how this affects how Phoenix manages the portfolio. DXS is predominantly an owner of high quality office properties across Australia. CQE is predominantly an owner of smaller properties leased to childcare providers on triple-net leases. CQE’s cash flow is boosted by a lack of incentives and capex. Childcare property rent is also an income stream heavily supported by the government, with support for funding of the sector a politically bipartisan issue. As at period end, DXS’ office cap rate implied by its share price was greater than 8.3%. CQE’s implied cap rate was more than 6.8%. If one were to merely compare cap rates, DXS would be the more attractive investment opportunity. It however faces significant cash outflows (in the form of capex and incentives) beyond what is measured in a cap rate. As such, Phoenix has held no position in DXS for some time and holds an overweight position in CQE.
 

The Detail is Important

Cap rates have the benefit of being simple. In the past they were also a reasonable way to compare property. As incentives and capex levels have diverged between different properties, merely looking at cap rates has become a less appropriate way to consider the relative attractiveness of different properties. By developing a more nuanced understanding of what’s truly “in a cap rate”, investors can make more informed decisions. Remember, the devil is always in the details, and in real estate investing, those details often lie beyond the simple cap rate calculation.
 

About Cromwell Phoenix Property Securities Fund

Read more about Cromwell Phoenix Property Securities Fund, including where to locate the product disclosure statement (PDS) and target market determination (TMD). Investors should consider the PDS and TMD in deciding whether to acquire, or to continue to hold units in the Fund.

Person typing on a laptop

Learn

Home Archives for brunoconsiglio
August 1, 2024

Actively managing our assets: 545 Queen Street, Brisbane

As part of Cromwell’s approach to actively managing assets, the performance of each property is continually appraised – relative to market demand; possible future uses; socio-demographic profiles; and growth corridors. Understanding the property cycle, future capital works, and the demand for continuing occupation underpins every asset management and refurbishment strategy across our business. In this edition we profile Cromwell’s activity at 545 Queen Street in Brisbane.

545 Queen Street was acquired by Cromwell Funds Management in May 2021 for $117.5 million, on behalf of Cromwell Direct Property Fund (DPF) unitholders. Occupying its own block, the property is prominently located at the northern entrance to Brisbane’s sought-after ‘Golden Triangle’ financial district.

Creating sustainable spaces in line with tenant demand

In April 2024, 545 Queen Street was awarded a 6.0-star NABERS Energy rating for the first time ever, up from 5.5 stars in the previous period. NABERS (National Australian Built Environment Rating System) provides simple, reliable, and comparable sustainability measurement across building sectors, such as hotels, shopping centres, apartments, offices, data centres, and more.

A NABERS Energy rating is compulsory whenever an office building larger than 1,000 square metres is being sold or leased in Australia – a 6.0-star rating is the highest that can currently be achieved.

Top-rated NABERS buildings are highly sought after by blue-chip and government tenants. Indeed, from 1 July 2025, Australian Government specifications dictate that, where a government tenant leases an office space of 1,000 square metres, or above, for four or more years, the office space and the building in which it is located must have and maintain a 5.5 star or higher base building and tenancy NABERS Energy ratings.

Given the prevalence of government tenants in a number of Cromwell buildings, we are taking steps to increase our NABERS ratings across all assets, where possible.


545 Queen Street’s impressive 6.0-star rating in April was the culmination years of sustainability planning and energy saving initiatives, in addition to ongoing consultation with Australian energy solutions provider, Conservia.

Conservia was engaged to help save energy through the modification of the building’s existing heating, ventilation, and air conditioning (HVAC) system. Energy control strategies implemented at 545 Queen Street have included:

  • Carefully monitoring individual office conditions and modifying the building’s HVAC operating system to only supply cooling/heating to required levels, instead of unnecessary high/low temperatures. This approach has allowed Cromwell to reduce the HVAC system’s chiller operation time – as well as machinery pump and fan speeds – which, in turn, has saved energy.
  • Undertaking calculations regarding the ‘optimum start time’ of the HVAC system – this means tenants are greeted with the desired temperature in their office space when they first walk in the door each day, but the cooling/heating system is not turned on too early in the morning, thus reducing energy consumption.
  • Similarly, calculating the ‘optimum stop’ process, so that the HVAC equipment can be powered down over time toward the end of the day, while still meeting tenants’ comfort conditions.
  • Turning off the HVAC system when it is not required to be running.
  • Monitoring indoor environmental quality markers in the office spaces, such as carbon dioxide levels. By better understanding these markers, the HVAC system can be programmed to pump in fresh air from outside, which naturally cools the building without the need for other elements in the cooling system to be turned on.
  • Installing smart alarms that alert building users to excess energy and water usage.
    Pinpointing areas of electrical overuse through automated monitoring systems, reducing the need for manual checks.
  • Assisting NABERS assessors to ensure all tenant exclusions are being counted.
    Continuous refining of HVAC control systems through the year; ensuring no out-of-sync sensors start or stop the system unnecessarily.
  • Regular monthly reporting on the system’s efficiencies and NABERS estimates through the year.

This approach saved almost 80,000 kilowatt hours (kWh) in 2023, compared to the previous year, meaning greater system efficiencies, thousands of dollars saved, and less impact on the environment.

545 Queen Street tenants awarded Cromwell an overall satisfaction level an impressive 11% higher than the Tenant Survey Index.


Learn more about other properties from the Fund. 

Keeping tenants satisfied

Measuring and understanding tenant satisfaction levels is core to Cromwell’s tenant retention strategy, and is critical in helping to maximise rental yield – which translates to greater investor returns.

Future Forma – an agency specialising in the independent evaluation of tenant–customer experiences across individual assets and portfolios – was engaged by Cromwell Property Group to conduct annual tenant surveys, commencing in August 2023.

67% of survey recipients at 545 Queen Street provided responses to the survey. A five-point ratings system was used for the survey:


Responses were marked against the Tenant Survey Index (TSI), which comprises of 350+ investment grade office building surveys throughout Australia, and is calculated as a rolling four-year average to ensure that data remains current.

Property Management Team Building services Overall score
545 Queen Street 99 85 92
Tenant Satisfaction Index 84 79 81

As seen in the table above, 545 Queen Street tenants awarded Cromwell an overall satisfaction level an impressive 11% higher than the Tenant Survey Index.


Leasing activity

A total of three new leases have been signed for 545 Queen Street in the last 12 months (to May 2024). Furthermore, one of the largest tenants in the building has exercised a two-year option over almost 1,500 sqm.


Property profile

Location and amenity are important considerations for both investors and tenants. Bounded by Edward, Queen, and Eagle Streets, the ‘Golden Triangle’ is a financial district in the heart of the Queensland capital, home to a number of prominent financial institutions, as well as corporate offices, restaurants, and high-end department stores.

At the northern end of this district is Cromwell’s A-grade, 10-storey 545 Queen Street office building, which sits on a 2,735 sqm parcel of land – with floor plates ranging from 750 sqm up to campus-style 2,138 sqm. The combined total net lettable area is 13,363 sqm, which is leased to a federal government tenant, as well as listed and blue-chip tenants – including Sonic Healthcare, and SeaLink Travel Group, the country’s leading marine transport provider.

High floor-to-ceiling glass windows provide excellent views of the iconic Story Bridge, which spans the Brisbane river below, and let in an abundance of natural light. The building’s foyer is bright and airy, with wide-open street views – and the ground level café area is both inviting and functional. Building users have access to upgraded end-of-trip facilities, including modern showers and change rooms, lockers, and bike racks.


Key statistics

76.9%
Occupancy as at 30 June 2024
Office
13,363 sqm
6.0-Star
4.5-Star
About Cromwell’s Direct Property Fund

The Cromwell Direct Property Fund is comprised of a quality portfolio of eight commercial property assets1 – including 100 Creek Street – with a long, 4-year weighted average lease expiry (WALE) and 54% of income sourced from government and listed tenants.

  1. The fund holds indirect interests in two of the assets via investments in underlying managed investment schemes, with CFM the responsible entity for both.

CFM has prepared the investment updates and is the responsible entity of, and the issuer of units in, the funds referred to in the investment updates (the Funds). In making an investment decision in relation to a Fund, it is important that you read the disclosure document and the target market determination for that Fund. The investment updates for each Fund refer to the disclosure document (product disclosure statement and any supplementary product disclosure statement) issued for that Fund. The disclosure document and target market determination for each Fund are issued by CFM and are available from www.cromwell.com.au or by calling Cromwell’s Investor Services Team on 1300 268 078. Not all of the Funds are open for investment. Applications for units in open Funds can only be made on application forms accompanying the disclosure document for the Fund.

Person typing on a laptop

Learn

Home Archives for brunoconsiglio
July 25, 2024

June 2024 quarter ASX A-REIT market update

Stuart Cartledge, Managing Director, Phoenix Portfolios


Market Commentary

The S&P/ASX 300 A-REIT Accumulation Index gave up some of its first quarter gains, falling 5.7% in the June quarter. Property stocks underperformed broader equities in the quarter, with the S&P/ASX 300 Accumulation Index losing a lessor 1.2%. Stronger than expected inflation figures led market participants to believe that any expected interest rate cuts by the Reserve Bank of Australia would be delayed, or that the next change in interest rates may even be a move higher.

Property fund managers saw quite divergent performance across the quarter. Goodman Group (GMG) led the way, rising 3.2%, significantly outperforming the broader property sector. GMG’s ongoing outperformance is leading to the unusual situation in which it now accounts for almost 40% of the entire property index. The impact on benchmark returns is clear, with the median property stock in the index down 8.6%, significantly more than the reported 5.7%. Centuria Capital Group (CNI) was also an outperformer in the period, giving up only 2.9%. Alternatively, each of Charter Hall Group (CHC), Elanor Investors Group (ENN) and Qualitas Limited (QAL), meaningfully underperformed, falling 17.0%, 14.4% and 10.6% respectively.

Office property owners were underperformers in the June quarter, as transactional evidence began to filter through after a dearth of transactions in recent periods. Dexus (DXS) reported the $296.2 million sale of 50% of 5 Martin Place, a somewhat new, A grade building in the heart of Martin Place in the Sydney CBD, at an implied capitalisation rate of above 6.1%. DXS also sold B grade asset, 130 George Street in Parramatta for $69.1 million at an implied capitalisation rate greater than 10% and more than 30% below its prior book value. Whilst this sale faced some asset specific concerns and Parramatta is a weaker submarket, the transaction reflects a challenging market for secondary office assets. DXS finished the quarter down 15.4%. Mirvac Group (MGR) pleasingly announced the unconditional exchange of a 66% interest in its 55 Pitt Street office development project, with an end value of approximately $2 billion, highlighting some demand for prime office investments. MGR also announced it had delivered on previously announced sales, including 367 Collins Street in the Melbourne CBD, which faced some prior delays. MGR was down 18.2% on the quarter. Centuria Office REIT (COF) was also weak, losing 15.0%, as was Growthpoint Properties Australia (GOZ), off 10.8%.

Residential property developers delivered mixed performance during the period, with the prospect of delayed interest rate cuts fighting against an ongoing supply/demand imbalance. There has been significant divergence in home price performance and new home sales across the country. After underperforming for many years, Perth has seen median dwelling price growth of more than 23% year over year, with some growth corridors significantly outpacing that number. Perth-based residential developers outperformed, with Finbar Group Limited (FRI) moving 21.7% higher and Peet Limited (PPC) up 0.4%. Melbourne has been significantly weaker, with new home and land sales falling meaningfully. The median dwelling value in Brisbane is now almost 10% above Melbourne and both Adelaide and Perth median dwelling values are within 3.5% of Melbourne. AV Jennings Limited (AVJ) has meaningful exposure to the Australian East Coast and dropped 19.7%. Stockland (SGP) was also a weak performer, giving up 10.6%.

Shopping Centre owners were also weak performers during the period, as consumer confidence and retail sales are beginning to show signs of fading. Some retailers including Mosaic Brands and KMD Brands (owner of Kathmandu), provided updates suggesting that conditions had been challenging in recent periods. Vicinity Centres (VCX) was a meaningful underperformer, off 13.1%, whilst Scentre Group (SCG) dropped 8.0%. Owners of smaller centres were not spared, with Charter Hall Retail REIT losing 12.4% and Region Group (RGN) finishing the quarter 9.2% lower.

Market outlook

The listed property sector is in good shape and provides investors with the opportunity to gain exposure to high quality commercial real estate at a meaningful discount to independently assessed values. While share market volatility may be uncomfortable at times, the offset is liquidity, enabling investors to rebalance portfolios without the risk of being trapped in illiquid vehicles.

Rising interest rates have been a headwind for many asset classes, with property, both listed and unlisted, a particularly interest rate sensitive sector. The February reporting season saw stocks providing solid updates, with cautiously optimistic outlooks, based on the assumption that interest rates may have peaked. Long term valuations are driven by “normalised” interest costs, meaning the impact of short term hedges maturing is mostly immaterial. Should the forecast decline in interest rates eventuate, recent headwinds may dissipate and possibly reverse.

The industrial sub-sector continues to be the most sought after, given the tailwinds of e-commerce growth, the potential onshoring of key manufacturing categories and the decision by many corporates to build some redundancy into supply chains to cope with current disruptions. All of these factors are contributing to ongoing demand for industrial space, which is evident by rapidly accelerating market rents and vacancy rates at historic lows of around 1% in many markets.
We remain cognisant of the structural changes occurring in the retail sector with the growing penetration of online sales and the greater importance of experiential offering inside malls. Recent performance of shopping centre owners has however been strong, with consumers showing resilience. It is interesting to note the juxtaposition of very high retail sales figures despite very low levels of consumer confidence, no doubt impacted by rising costs of living. Importantly, we are also now seeing positive re-leasing spreads in shopping centres, indicating strengthening demand from retail tenants.

The jury is still out on exactly how tenants will use office space moving forward, but demand for good quality well located space remains. Leasing activity is beginning to pick up, and there has also been some transactional activity, albeit at prices typically at discounts to book values. Incentives on new leases remain elevated.

We expect to see further downside to asset values in office markets, but elsewhere expect market rent growth to largely offset cap rate expansion, particularly in industrial assets. Listed pricing provides a buffer to such movements.

The content above is taken from the Cromwell Phoenix Property Securities Fund quarterly report. Sign up here to be the first to access the latest report and to gain a deeper insight into the Fund’s performance.

Performance commentary

Fill out the form below to view the full commentary.

This field is hidden when viewing the form
I am a
I am interested in:

All personal information submitted will be treated in accordance with our Australian Privacy Policy. By submitting personal data to Cromwell Funds Management, you agree that, where it is permitted by law and in accordance with our Australian Privacy Policy or where you have agreed to receive communications from us, Cromwell Funds Management may use this information to notify you of our products and services and seek your feedback on our products and services. Please note you can manually opt out of any communications.

Person typing on a laptop

Learn

Home Archives for brunoconsiglio
July 22, 2024

June 2024 direct property market update

Economy

Financial markets remained volatile over the quarter, reflecting participants’ keen focus on the outlook for interest rates. A major event during the quarter was the release of the 2024-25 Federal Budget on 14 May, with the state and territory budgets also released over the course of May and June1. The Budget was slightly more accommodative and stimulatory than expected, spearheaded by a $300 per household electricity rebate and additional Commonwealth rent assistance. Many of the states followed suit, offering cost-of-living supports such as further electricity rebates, public transport fare reductions, fee indexation freezes (e.g. vehicle registration), and vouchers for families.

Federal and state governments felt pressured to act, given the ongoing squeeze on households from higher interest rates, tax bracket creep, and inflation. Retail spending continues to record very weak levels of growth, while the latest consumer sentiment print remained in deeply pessimistic territory2. More broadly, economic growth has fallen to its lowest annual pace since 1992 (excluding the pandemic), as per the March National Accounts (released June).


The key question – which will only be answered in time – is what impact the Budget measures will have on inflation, which is not slowing as quickly as the RBA had forecast? Headline inflation will be lowered by the subsidies, which should help slow inflation by reducing administered prices (i.e. CPI-linked costs). The lower headline rate may also help keep inflation expectations anchored to the RBA’s target band. On the flipside, headline inflation will get a bump in 2025 when the subsidies unwind, potentially having the opposite effect. Spending power will also be increased, with the net outcome dependent on households’ propensity to either spend or save the extra cash. Categories such as clothing could absorb additional spending without adding to inflation pressures given the spare capacity which is emerging in discretionary parts of the economy. Additional spending on supply-constrained essentials, such as housing, would be more likely to elicit an inflationary response.

Annual_Inflation_May24

Office

Divergence in performance between markets continues to be a dominant theme in office. Analysis of JLL Research data indicates national CBD net absorption of almost +8,000 square metres (sqm) was recorded over the quarter. Perth CBD (+12,000sqm) recorded the strongest net demand while Melbourne CBD struggled (-27,000sqm). The weakness in Melbourne was driven by A Grade stock, the Western and Eastern Core precincts, and small tenants occupying less than 1,000sqm. Small tenants accounted for 90% of the space contraction, an anomaly compared to other markets and the post-COVID trend.


Weaker space demand and elevated levels of new stock completions led to material vacancy rate increases in the Sydney and Melbourne CBDs. These markets outweighed the vacancy decline observed across the smaller markets, causing the national CBD vacancy rate to increase from 14.7% to 15.4%. Further illustrating the divergent performance by market, Brisbane CBD is currently sitting at its lowest vacancy rate since 2012, while the Sydney and Melbourne CBDs are at their highest vacancy rates since the mid-90s.

Total_vacancies_June24

Prime net face rent growth (+1.0%) matched the average quarterly pace of the past three years. Reflecting its favourable supply-demand conditions, Brisbane CBD was the standout market recording growth of +1.8%. Brisbane also saw prime incentives decline by -1.1%, while the other CBD markets were largely unchanged. These movements resulted in strong net effective rental growth of +3.4% for Brisbane CBD, with Melbourne CBD the weakest performer for the fourth consecutive quarter.


Capital markets continue to thaw, leading to improved
price discovery and narrower bid-ask spreads. National CBD average prime yields expanded 33bps over the quarter, taking total expansion to 182bps since the 2022 peak in values. Transaction volume for this quarter totalled $2.7 billion, representing the most active quarter since Q3 2022. Sydney CBD accounted for nearly 60% of activity, double its average share over the last decade. Mirvac’s sale of a ~66% stake in the 55 Pitt Street development to Japanese investor Mitsui Fudosan was the main transaction, supported by the 50% sale of 5 Martin Place to an existing co-owner. There was also meaningful transaction activity in the Brisbane CBD, being the only other market where volumes exceeded the quarterly average of the past five years. This was headlined by Quintessential’s acquisition of 240 Queen Street, which took more than a year to close.

Retail

There was little movement in rents over the quarter. According to JLL Research, net rents were unchanged across large discretionary shopping centres (Regionals). Growth in convenience-oriented centres (Sub-Regionals and Neighbourhoods) was slightly more positive, averaging +0.3%. This was due to very strong growth in South East Queensland, where Sub-Regionals and Neighbourhoods both recorded quarterly growth of +1.7%.

Positively for Regional centres, the vacancy rate was largely unchanged over the quarter and is in line with the 10-year average. Conditions are particularly strong across South East Queensland and Adelaide Regionals, where the vacancy rate is 1.6% and 1.7% respectively. A weaker vacancy result was recorded across Sub-Regionals and Neighbourhoods, with most markets sitting above historical average levels.

After a very quiet first quarter, transaction volume returned to a healthy level over the three months to June. Activity was headlined by the sale of Stockland Glendale (to IP Generation) and a 50% stake in Westfield Tea Tree Plaza changing hands from Dexus to a Scentre Group/Barrenjoey partnership. While Sub-Regionals represented the greatest share of transaction volume, activity was also solid across Neighbourhoods and Large Format centres. Average yields were unchanged across the quarter.

Industrial

According to JLL Research, gross occupier take-up rebounded from the soft first quarter to total just over 700,000 sqm. While leasing activity has slowed from pandemic highs, on a rolling 12-month basis it is still running at a faster pace than any period pre-2021 (data back to 2007). The main driver of weaker take-up is Retail & Wholesale Trade, potentially reflecting cautiousness from occupiers in the face of weak retail sales, together with a ‘pause’ to expansion after substantial take-up during the pandemic. Manufacturing continued to outperform, recording gross take-up 10% higher than its 5-year average, with activity particularly strong in Melbourne and Perth. Construction also saw an elevated quarter of activity but remains a small proportion of the industrial market.


Rental growth remains above the long-term average rate despite a weakening of demand relative to supply. Land constrained precincts such as the Brisbane Trade Coast and South Sydney recorded quarterly rental growth of around 5%, with Melbourne’s South East the only precinct to record higher face rental growth. Prime incentives increased in most markets along the East Coast, leading to softer rental growth outcomes on a net effective basis.

Just over 1 million sqm of industrial supply was delivered during the quarter, representing the second biggest quarter of completions behind Q2 2022. Activity was heavily concentrated in Melbourne, which accounted for 55% of supply nationally with four of the five largest projects. A further 1.8 million sqm of supply is currently under construction and slated for delivery in 2024. However, more than half of this floorspace is scheduled for completion in the last quarter of the year and hence is at risk of slipping into 2025 given ongoing project delays. While extended delivery schedules and solid pre-commitment levels are helping prevent a flood of unleased supply from entering the market, elevated completions relative to demand are likely to see the vacancy rate – and rental growth – trend towards the long-run average.

There was further improvement in transaction activity this quarter with dollar volume increasing to $3.2 billion, the highest quarterly level seen since Q4 2021 and the strongest result outside of that record year. The portfolio sale of 12 Goodman assets across Sydney and Melbourne, jointly acquired by Barings and Rest, was the main transaction. Capital continues to be attracted to Sydney, which accounted for 53% of transaction volume (excluding multi-market portfolio deals). Yields were largely unchanged over the quarter, with 25bps of expansion in Sydney North and Brisbane Trade Coast the only notable movements.

If rates are held steady, the labour market continues to soften, and disinflation resumes its downwards trend, we should see further improvement in capital market liquidity and property transaction activity.


Outlook

The RBA meeting on 6 August is the key event of the September quarter. The decision to hike or hold rates will be dependent on June quarter inflation (released 31 July) and June labour data (released 18 July). While there is a case for monetary policy to be more restrictive, the RBA has adopted the position that preserving employment gains is a key priority and so the threshold for a hike is high.
If rates are held steady, the labour market continues to soften, and disinflation resumes its downwards trend, we should see further improvement in capital market liquidity and property transaction activity. While there are risks to the outlook such as shipping disruptions, volatile election outcomes, and conflict escalation, the Australian economy appears to still be on the narrow path towards a soft landing.

How did the Cromwell Funds Management fare this quarter?

In April, approximately 25% of the Cromwell Direct Property Fund (DPF) portfolio was revalued, with another 17% in May and 52% in June. Eight of the fund’s nine assets have now been independently revalued. Overall, from December last year, capitalisation rates have softened by 30bps to a weighted average of 7.18%, equating to a 3% fall across the portfolio, which is now valued at $607 million.

The Brisbane office market, where just under 55% of DPF’s portfolio is held, is experiencing strong fundamentals. This is evidenced by positive net absorption, a decrease in headline vacancy and positive net effective rental growth of 3.4% for the quarter, and 14% over the past 12 months. As noted in the market update above, Brisbane is leading the country for rental growth and is currently one of the strongest-performing leasing markets in the APAC region.

High construction costs and upward pressure on labour, helped along by Queensland’s significant infrastructure pipeline over the next 3-4 years, will see supply constrained for some time, which bodes well for leasing demand and future rental growth on existing assets. Additionally, the anticipated rapid increase in immigration is likely to further drive demand for commercial office space, as well as in the medical, retail, and industrial sectors.

While Cromwell is optimistic that valuations have experienced the worst of the cycle and will now stabilise, it is pertinent to note that recent CPI prints and the Reserve Bank of Australia’s neutral stance on rates may delay this stabilisation. In the interim, Cromwell’s key focus remains on maximizing portfolio performance to help ensure the delivery of regular distributions.

Portfolio updates for the quarter
Cromwell is continuously exploring ways to enhance the tenant experience and improve the amenities offered within its buildings. The implementation of a tenant portal, Cromwell Connect, is currently underway across several of our assets. This portal will enable tenants to access various forms of data, make bookings for communal training or meeting rooms and interact with retailers for services such as ordering coffees, booking dry cleaning, and reserving Pilates classes.

Cromwell Property Trust 12’s (C12) Dandenong asset recently underwent balcony refurbishment works, including the replacement of artificial turf with tiling. Additionally, 100 Creek Street in the Brisbane CBD is undergoing a comprehensive lift modernisation, which includes the upgrade of lift motors, with a heating upgrade project scheduled for later this financial year.

The solar works at Dandenong, Mascot, and Townsville assets have now been completed and energized, resulting in seven of the nine DPF assets benefiting from solar power.

The portfolio experienced strong leasing performance for the quarter, with six deals signed at 100 Creek Street, four of which were completed using existing spec fitouts. The other two were renewals on just under 1,300 sqm. Furthermore, one of the largest tenants at Queen Street exercised a 2-year option over almost 1,500 sqm, and at Mascot, a 5-year renewal with a tenant secured in 2023 was recently completed, occupying just under 1,300 sqm. Cromwell is also receiving good levels of enquiry over a couple of full-floor vacancies in Brisbane and Adelaide.

The portfolio currently maintains a 95.5% occupancy rate, with a weighted average lease expiry of 4 years.

Cromwell’s asset management and projects teams remain hard at work to maximise occupancy across the portfolio, whether by renewing current tenants or relocating them within the buildings using existing fitouts. This approach allows the cost of incentives to be spread across the lease term rather than funded upfront. Moreover, Cromwell is dedicated to maximising energy efficiency and maintaining and improving NABERS ratings through carefully planned lifecycle programmes aligned with decarbonisation plans and ESG initiatives. In April, 545 Queen Street was awarded a 6.0-star NABERS Energy rating for the first time, an improvement from its 5.5 stars. This achievement was the result of years of sustainability planning, energy-saving initiatives, and ongoing consultation with Australian energy solutions provider, Conservia.

Cromwell is pleased to be progressing on its net zero pathway, having already achieved a 73% reduction in emissions across the DPF portfolio3.

Read more about the Cromwell Direct Property Fund: www.cromwell.com.au/dpf.

Past performance is not a reliable indicator of future performance.

Cromwell Funds Management Limited ACN 114 782 777 is the responsible entity of and issuer of units in the Cromwell Direct Property Fund ARSN 165 011 905.

Before making an investment decision in relation to the Fund it is important that you read and consider the Product Disclosure Statement and Target Market Determination available from www.cromwell.com.au/dpf, by calling 1300 268 078 or emailing invest@cromwell.com.au.


  1. Except for the Tasmanian Budget which has been delayed from May to September.
  2. Consumer Sentiment (Westpac-Melbourne Institute, May-24)
  3. This excludes Queen Street in Brisbane which is undertaking a decarbonisation audit in FY25
About Cromwell Direct Property Fund

Read more about Cromwell Direct Property Fund, including where to locate the product disclosure statement (PDS) and target market determination (TMD). Investors should consider the PDS and TMD in deciding whether to acquire, or to continue to hold units in the Fund.

Person typing on a laptop

Learn

Home Archives for brunoconsiglio
May 1, 2024

Actively managing our assets: 95 Grenfell Street, Adelaide

Chesser House at 95 Grenfell Street, Adelaide, was acquired by Cromwell Funds Management in April 2022 for $81.35 million, on behalf of Cromwell Direct Property Fund (DPF) unitholders. The 11-storey building has a total net lettable area of 11,155 sqm, with rental income underpinned by blue-chip building users, as well as federal and state government tenants.

Leasing Activity

A total of four new leases have been signed for Chesser House in the last nine months (to 1 April 2024), including a significant state government tenant.


In-building amenity

As part of Cromwell’s approach to asset management, the performance of each property is continually appraised – relative to market demand; possible future uses; socio-demographic profiles; and growth corridors. Understanding the property cycle, future capital works, and the demand for continuing occupation underpins every asset management and refurbishment strategy across our business.

The most recent tranche of building works at Chesser House was completed in September 2023. These works involved installation of a full-floor LED lighting, ceiling finishes, floor finishes, and services upgrades; a lift lobby refurbishment on Level 9; and a brand-new end-of-trip facility with a dedicated bike storeroom . Consequently, these works resulted in two new leases being signed.

In addition, a 93KW solar panel system was installed, which generates 17% of the total base building power. The property has maintained its NABERS Energy Rating at 5.0 Stars, with Green Power at 22.5%. The NABERS Water Rating is currently 4.5 Stars.

Across our business, Cromwell’s Asset Management team continues to take shifting tenant requirements into consideration, such as those post COVID-19, when designing these spaces. The recent focus has been on designing breakout areas and collaboration zones in addition to providing quiet rooms to those wishing to concentrate on tasks or avoid distraction.


End-of-trip facilities

The end-of-trip design utilised a neutral colour palette accentuated by premium finishes that complement the recently completed building lobby. An indigenous artwork called “Waves of Hope” by Samantha Webster was also commissioned via Wall Trade.

A considerable number of bike racks were installed by market-leading bike room creators, Five at Heart – included to meet the increasing demand of people cycling to work.


95 Grenfell Street tenants awarded Cromwell an overall satisfaction level 4% higher than the Tenant Survey Index


Keeping tenants satisfied

Measuring and understanding tenant satisfaction levels is core to Cromwell’s tenant retention strategy, and is critical in helping to maximise rental yield – which translates to greater investor returns.

Future Forma – an agency specialising in the independent evaluation of tenant–customer experiences across individual assets and portfolios – was engaged by Cromwell Property Group to conduct annual tenant surveys, commencing in August 2023.

75% of survey recipients at Chesser House provided responses to the survey. A five-point ratings system was used for the survey:


Responses were marked against the Tenant Survey Index (TSI), which comprises of 350+ investment grade office building surveys throughout Australia, and is calculated as a rolling four-year average to ensure that data remains current.

Property Management Team Building services Overall score
95 Grenfell Street 90 80 85
Tenant Satisfaction Index 84 79 81

As seen in the table above, 95 Grenfell Street tenants awarded Cromwell an overall satisfaction level 4% higher than the Tenant Satisfaction Index.


Property profile

The property is located in the heart of the South Australian capital and provides direct linkages to major transport routes, as well as connectivity to Adelaide’s premier retail precinct, Rundle Mall, and the grassy Hindmarsh Square. The parallel Pirie Street has also emerged as a leading entertainment, food and beverage destination for locals and visitors to the City of Churches.

The property façade was last upgraded in 2017 and features a steel structured lightbox fitted with contemporary LED lighting coupled with translucent panels. The lighting can be programmed remotely to adjust the colour, luminosity, and function of the lightbox, providing a striking visual appearance.

Inside the building, a double-height entrance lobby gives way to a working lounge and café, as well as a 7-metre feature green wall, fitted with engineered grow lights and an irrigation system. The foyer space provides quiet, sophisticated meeting spaces for tenants to use.


Key statistics:

91.5%
Occupancy as at 31 March 2024
Office
Sector
11,155 sqm
Net lettable area
5.0-Star
NABERS energy rating
4.5-Star
NABERS Water rating
About Cromwell’s Direct Property Fund

The Cromwell Direct Property Fund is comprised of a quality portfolio of nine commercial property assets – including 100 Creek Street – with a long, 4.2-year weighted average lease expiry (WALE) and 53% of income sourced from government and listed tenants.

Person typing on a laptop

Learn

Home Archives for brunoconsiglio
May 1, 2024

An introduction to property valuations

Cromwell’s Investment Manager, Lachlan Stewart, is an experienced commercial real estate professional, who has spent more than 20 years working for highly respected organisations, including Colliers International and GE Capital Real Estate. He specialises in property valuations and financial modelling.

The importance of valuations

Section 601FC(1)(j) of the Corporations Act imposes an express obligation on a commercial property owner to ensure that the scheme property, which includes any real estate, is valued at regular intervals appropriate to the nature of the property. A company can decide to internally value or externally value a property.

As such, a commercial property valuation is the most reliable way of determining the market value of an income-producing property – it serves as an important, professionally backed tool for owners, investors, banks, regulators, and other interested parties.

Unlike residential property, commercial properties can be complex in the way that they are valued, given that every commercial opportunity is driven by a different set of needs and unique contributing factors. These factors will be explored in greater detail below.

Types of valuations

External valuation services

To undertake a property valuation of an asset, building owners engage external, independent commercial property valuers. These valuers generally:

  • are independent of the property owner
  • are authorised to practice as a valuer
  • have experience in valuing properties like that owned by the property owner
  • are registered or licensed in the relevant state, territory, or overseas jurisdiction in which the property is located
  • subscribe to a relevant industry code of conduct in the jurisdiction where the property is located
  • should have no conflict of interest in relation to the valuation.

Internal valuations

In some instances, building owners may choose to conduct an internal valuation. A company’s Board may value a property itself where, in its reasonable opinion, it is not necessary or not practically possible for a valuation to be obtained from an external valuer. This valuation type typically uses the same methodology and metrics as independent, external valuations.

Commercial property valuation is the most reliable way of determining the market value of an income-producing property – it serves as an important, professionally backed tool for owners, investors, banks, regulators, and other interested parties.

How properties are valued

There are two main methods of valuation that are routinely applied to the asset valuations in Australia – the income capitalisation approach and the discounted cash flow approach. It should be noted that there are other methods of valuation, but, for the purposes of this article, we will examine these two most common methods.

Income capitalisation approach

The income capitalisation approach to property valuation examines the net income a property would achieve in an open market – regardless of whether it is leased or vacant – divided by the appropriate capitalisation rate, to give the core value of the asset.

The capitalisation rate (cap rate) (yield) is the component that moves with market forces, such as interest rate changes, economic growth, vacancy rates, inflation, and lease covenants. The capitalisation rate is similar to the price-earnings multiple, often used when valuing shares. Valuers will also look at the capitalisation rates of comparable sales over the previous 12 months when calculating the market value of an asset.

In example 1 consider a property, which produces income of $100,000, is capitalised at 6.0% – the market value would be $1,666,666.

If, due to market forces, the capitalisation rate tightened to 5.0%, and the income remained the same, the market value of the property would increase as per example 2.

Example 3 demonstrates if the capitalisation rate rose to 7.0%, and the income remained the same, the capitalised value would decrease.


As you can see, market value moves inversely from capitalisation rates.

Once an asset value is determined, valuers can adjust for certain variables.

For instance, the valuers would make an adjustment for how much the current tenants are paying, compared to what the market rent of that property should be. Likewise, there would be adjustments made for any discount or tenant incentives that a building owner is applying to that space for the duration of those tenants’ leases.

As part of this approach, valuers also look forward over the immediate horizon – which might be anywhere between 12 and 36 months – to consider any near-term lease expiry and will make an adjustment to reflect the costs associated with that downtime and re-leasing. They will examine whether there is any vacant space, as well as the costs associated with leasing that space out.

Valuers also look at any capital expenditure (capex) considerations that there might be. For example, if there’s a broken lift, and it’s estimated that $5 million will be required for a replacement, adjustments will be made to the core value, to end up with the market value. That value is applied to a point in time – “as at” the day of valuation.

Discounted cash flow approach (DCF)

More assumptions are involved in a DCF when compared to the income capitalisation approach – including the target return or discount rate, rental growth, lease expiry allowances, renewal probability, capital expenditure, and a hypothetical sale profit– but it has the potential to provide a more accurate picture of the cash flow horizon over a longer period.

Using this method, valuers typically forecast a 10-year cash flow, with a hypothetical sale profit at the end of year 10. All the income over 10 years is discounted back to a present-day value at an appropriate discount rate. An exit terminal value at year 10 (for the hypothetical sale, using an appropriate terminal yield) is also discounted to a present-day value. To derive the net present value of the property, it becomes the sum of the discounted property cash flows and the discounted terminal value.

Determining an appropriate discount rate

To determine an appropriate discount rate, a comparison is made with returns from alternative investments, the most common comparison being the 10-year government bond rate, as it is considered ‘risk-free’ and matches the investment horizon. A premium is then applied to reflect the risk of a property investment when compared to the ‘risk-free’ rate.

Adjustments

Adjustments are made within the 10-year cashflow. For example, consider a multi-tenanted building. Realistically, not all tenants are going be there for the entirety of that 10-year horizon – so, these lease expiries are factored into existing lease cash flows.

The valuer considers what happens when each tenant’s lease expires, applying a renewal probability of that tenant remaining (or leaving) and applying associated costs for potential downtime, capex to refurbish the space and the costs associated with re-leasing (leasing fees, incentives, etc.).
If an expiry is in six years, for example, the valuer has an informed opinion of what the market rental should be as at today, and then they’ll apply a growth rate to get to the market rent at that point in time. They’ll also apply a tenant incentive and will have a hypothetical lease term at that point in time.

So, the valuer is making a lot more assumptions here than what they would do in a capitalisation approach – but they’re also getting a longer horizon of cashflows to look at.

Capital markets can also influence cap rates. If a particular asset class or sector becomes more desired, the price investors are willing to pay per unit of income will increase and vice versa.

Contributors to a property’s value

The two biggest contributors to determining a property’s value are: a) the net market income it can deliver; and b) the appropriate rate of return. An appropriate rate of return is the appropriate “multiple” or risk premium to apply to the income (like price-earnings) considering asset and market-level risk factors.

Both the net market income and the rate of return are affected by property and market-level considerations.

Property characteristics

There are all kinds of property characteristics that contribute to determining an asset’s value. This includes the physical and locational characteristics of the land itself – for instance, an office building in the middle of the Sydney CBD is going to be worth more than that exact same building and lease profile in a metropolitan or regional market.

There are several additional factors that are important, including access to transport, amenity, natural light, and physical characteristics of the building. The desirability of the building for tenants is important to consider – for example, in a residential context, properties on Sydney Harbour or Brisbane River are worth more than those away from the waterfront. For commercial property tenants, proximity to customers and suppliers is also important, as are end-of-trip facilities; operational efficiency/sustainability; design and ambience; and floorplate layout.

And then there is the tenant occupied characteristic – is a leased building worth more than an unleased building or a vacant building? Usually, the answer is that the leased asset has a higher value. Other factors, including weighted average lease expiry (WALE) are factored into the valuation – longer WALE is usually valued more highly, due to the security of the income and lack of capital expenditure (capex)/downtime assumptions. Spaces occupied by blue-chip tenants and government departments are generally valued more highly, due to the security underpinning the lease.

Similarly, costs associated with the property also come into consideration – a building that requires a heavy amount of capex is generally going to be worth less than a building that’s just had a large amount of capex spent on it.

Market conditions

Broader market conditions also play an important role in determining asset values at a point in time. As explained above, movement in the ‘risk-free’ rate influences the appropriate risk premium to be applied to a property’s cashflow, and is affected by interest rates, inflation, and other financial and economic conditions.

Surging inflation and higher interest rates have been a major driver of recent cap rate movements, with the cash rate target increasing by 4.25% since March 2022, and the 10-year government bond yield increasing by 1.69% over the same period. This has led to a similar rise in cap rates, in order to maintain the typical ‘spread’ between the risk-free rate and property. The table below highlights the shift using New South Wales/Sydney as an example.


Property Avg Equivalent Yield Prime CBD Office Outer Central West Sydney Industrial NSW Regional Shopping Centres NSW N’hood Shopping Centres 10y Gov Bond Yield
Mar-22 (%) 4.44 3.26 5.13 5.13 2.50
Dec-23 (%) 5.69 5.25 6.00 6.25 4.19
Change (bps) 125 200 87 113 169
Spread to Gov Bond (bps) 150 106 181 206 na
Historical (25y) Avg Spread (bps) 184 310 200 340 na


Uncertainty regarding the future can also be an influence on cap rates. This has been exemplified by office valuations, where the impacts of hybrid working on office space demand are yet to be fully understood. While some of the potential impacts may be reflected in rental growth assumptions, some may be reflected in the cap rate as a general measure of higher risk.

Capital markets can also influence cap rates. If a particular asset class or sector becomes more desired, the price investors are willing to pay per unit of income will increase and vice versa. This was seen over the last five years across the industrial sector. Institutional investors in particular viewed the sector more favourably than had been the case historically, contributing to a greater weight of capital pursuing an allocation – the magnitude of the capital shift outpaced the ability of the market to supply new stock, leading to higher valuations.

In summary

In the face of fluctuating markets, a commercial property valuation is the most reliable way of determining the representative value of Cromwell’s income-producing assets. As a business, we adhere very closely to the methods outlined above to provide investors with clear and accurate information on each of our assets. Cromwell will continue to provide transparency about the valuation process – and how our properties are valued, as the information is generated.

Person typing on a laptop

Learn

Home Archives for brunoconsiglio
January 23, 2024

December 2023 direct property market update

Peta Tilse, Head of Retail Funds Management


Economy

Over the December quarter, interest rates were reasonably volatile both in terms of short and longer-term rates. The RBA increased interest rates by 25 basis points (bps) in November, taking the cash rate to 4.35%; its highest level since the end of 2011. The justification for the move was to bring inflation to target within a reasonable timeframe (i.e. by end-2025), rather than risk a prolonged overshoot and upwards shift to inflation expectations.

Subsequently, softer than expected inflation offshore and in Australia, together with dovish comments from central banks, helped take some of the heat out of bond yields through to December. Australian government 10-year bond yields decreased by 52bps over the quarter to 4.0%.

More recent data has shown Australia’s annual inflation pace slowing quite materially from 4.9% in October to 4.3% in November1. While there could be an uptick in Q1 2024 due to base effects and government subsidies rolling off, there was little in the latest data which would give the RBA cause for concern. Goods inflation continued to slow, and services inflation appears to have peaked. While dwelling and rental costs and insurance premiums rose further, dining out and household services eased. Overall, inflation is on track to undershoot the RBA’s forecast for the quarter, decreasing the likelihood of a hike in February.

cpi_forecast

While expectations of further cash rate hikes have diminished, 10-year bond yields remain approximately 40bps higher than a year ago2, putting pressure on debt costs and access to capital. The macro impact of interest rates continues to be the main challenge facing commercial property, despite bottom-up demand drivers remaining relatively resilient. This is being reflected in higher capitalisation rates (effectively the earnings multiple for property), and in turn putting downward pressure on asset valuations.

In further economic data, the labour market remains tight, however there are signs of softer conditions emerging. Unemployment increased to 3.9% in November (latest available data), the highest it has been since May 2022 and slightly above consensus expectations (3.8%)3. Hours worked was flat over the month leading to a higher underemployment rate, job ads declined, and there were more applicants per job – all signs of slowing. Positively, the increase in the unemployment rate has been orderly and driven by strong population growth (i.e. supply), rather than job destruction. In fact, annual jobs growth increased to 3.2%, with 104,000 jobs created over the quarter-to-date (65% being full-time), a positive for office space demand.

Office

There continues to be mixed demand readings between the major CBDs, largely aligned to the different industry compositions of the markets. According to JLL Research, national CBD net absorption totalled -59,000 square metres (sqm) across the quarter, the weakest result since March 2021. The resource-based markets of Brisbane (+9,000 sqm) and Perth (+7,000 sqm) both continued their run of positive demand, recording the strongest results of the quarter. Melbourne CBD recorded the weakest net absorption on a quarterly and annual basis, due to a couple of substantial A-Grade contractions in the Parliament precinct. It was the first quarter since March 2021 where Prime net absorption was weaker than Secondary net absorption.

net_absorp_dec23

The national CBD vacancy rate increased from 14.2% to 14.9% over the quarter, with the result following a similar pattern as net absorption. Brisbane CBD (-0.4%) recorded the biggest improvement in vacancy rate, while Melbourne CBD (+2.0%) deteriorated materially, due to the occupier contractions seen in the Parliament precinct. While headline vacancy remains elevated compared to the historical long-term average, particularly across Prime stock, the majority of CBD assets remain well-occupied (<10% vacancy).

total_vac_dec23

Prime net face rent growth (+0.9%) accelerated slightly compared to the prior quarter (+0.6%), with the Sydney CBD and Canberra the biggest improvers. Prime incentives were relatively stable across every CBD market except Melbourne (+1.0%) and Canberra (+0.3%). This meant that on a net effective basis, Melbourne and Canberra were the only markets where rents headed backwards over the quarter. Adelaide (+2.7%) recorded the strongest net effective rental growth, as Brisbane slowed after two quarters of very strong growth. Adelaide joined Brisbane and Perth as CBD markets where net effective rents are higher today compared to pre-pandemic.

rental_growth_dec23

Transaction volume for the quarter ($1.8 billion nationally) was roughly in line with the quarterly average over the rest of the year but was 66% lower than the Q4 average of the past five years4. The lack of transaction activity reflects the sharp increase in cost of capital seen over the past 18 months, and the gap between bidder and vendor price expectations which is taking time to align. It also reflects a lack of large transactions, with only one asset greater than $250 million changing hands during the quarter. This has been reflected in the total expansion of national CBD prime average yields to 120bps from peak pricing, with further expansion possible given the inherent lags in the valuation process.

Retail

There was a large rebound in retail sales in November (+2.0%), following a slow start to the quarter in October (-0.4%)5. November’s monthly growth was the strongest result since November 2021,when activity was boosted by post-lockdown reopening. It is important to note that Black Friday sales had a large positive impact, with spending surging across household goods, department stores and clothing. A decent portion of this spending was likely ‘brought forward’ from December, so Christmas data (due 30 January 2024) may be weaker.

Consumers remain under pressure, with Westpac’s measure of sentiment up in December but still at very pessimistic levels. While real disposable household incomes should improve in the latter half of 2024, elevated inflation and interest rates are expected to dampen per capita discretionary spending for some time yet.

retail_growth_nov23

Rental growth at large discretionary shopping centres continues to underperform though is positive. Large Format Retail was the top-performing sub-sector over the quarter, with rental growth benefiting from a lack of new supply across 2022 and 2023. This positive supply-demand dynamic saw Large Format vacancy decline over the quarter, while the other retail sub-sectors recorded slight increases.

It was a slow quarter for retail transactions, with volume totalling less than $1 billion. No large assets changed hands, following the sales of Stockland Townsville and Midland Gate Shopping Centre last quarter. As seen across most commercial property sectors, retail capitalisation rates expanded further over the quarter.

Industrial

Australia’s industrial market remains the tightest in the world, with a national vacancy rate of 1.1%6. The city-level figures are book-ended by Melbourne (1.6%) and Sydney (0.5%), while Brisbane saw the biggest increase in vacancy rate (+0.8%) over the second half of 2023. Vacancy has been rising in most offshore markets across the year and the trend has now reached Australia, reflecting ongoing supply and a softening of demand. While vacancy is increasing, it remains well below long-term average levels.

Softening of demand is consistent with a slowing global economy (hence lower trade volumes) and an unwinding of some of the e-commerce gains made through the pandemic years. However, net absorption continues to be positive, particularly in Sydney and Melbourne where newly developed stock is being readily taken up by occupiers whose expansion in prior quarters was constrained by limited availability. While the demand cycle is starting to slowly turn, low vacancy helped generate national super prime net face rental growth of 15% year-on-year as at 4Q23 (preliminary data)6. Prime incentives remain low compared to historical levels at around 10-15%.

Supply delivered in 2023 was elevated at around double long-term levels. Higher levels of supply are earmarked for completion in 2024, however delays due to planning, infrastructure servicing, and construction will likely see some of this development pushed into the following year (as was seen in 2022 and 2023). Ongoing supply will likely put upwards pressure on the vacancy rate, however solid levels of pre-commitment (already almost 50% across the East Coast) limit the risk of a blowout.

While investors remain relatively positive on the industrial outlook, as with other sectors, transaction activity was nevertheless muted. Volume over the course of 2023 was soft compared to recent record highs, but roughly in line with levels seen in the three years prior to the pandemic.


Outlook

The global economy is slowing but at a relatively measured pace, engendering optimism that a “soft landing” can be achieved. Australia’s economy is in a similar position, with inflation slowing but employment conditions softening but remaining resilient. Similarly, household consumption has slowed without falling precipitously. Markets are becoming more confident that the rate hiking cycle is at or near its end, which should help ease uncertainty and improve liquidity for property over the coming months.

These factors put the Australian commercial property market in relatively good stead from a demand perspective. While a slowdown is expected over 2024 and early 2025, a more significant contraction (i.e. recession) is looking less likely. Businesses will continue to review their space requirements as they adjust to hybrid working, though the balance between in-office versus remote is expected to shift towards the office over 2024. Location continues to be an important driver of occupier preferences, combined with amenity and building quality (at a given price point).

Capital continues to view Australia as a favourable investment destination given its attractive demographic profile, growth prospects, and relative social and political stability. As uncertainty abates and liquidity improves, transaction activity should increase. The best opportunities will present where sentiment has become dislocated from market fundamentals.

How did the Cromwell Direct Property Fund fare this quarter?

On 27 October 2023, Cromwell announced the termination of the proposed merger between the Cromwell Direct Property Fund (the Fund) and Australian Unity Diversified Property Fund, as a result of deteriorating market conditions.

Given market dynamics for Australian real estate markets, and in particular potential movement in office asset valuations, the Board decided it appropriate to externally revalue the Fund’s assets to identify if any values may have moved materially owing to the nature of the assets and market circumstances. The Fund’s gross asset value experienced an 8.9% decrease. While partially offset by rental growth, this decline is mainly attributed to elevated interest rates and a softer capital market in the second half of 2023, which led to a 72bps expansion of the Fund’s weighted average capitalisation rate, which now stands at 6.87%.

Despite the valuation decline, the Fund’s asset portfolio continues to experience positive leasing activities, particularly in Brisbane. The Fund has improved occupancy (on a look-through basis) to 96.4% as of December 31, 2023.

Effective 14 November 2023, the Fund temporarily suspended new applications and ceased to offer the Distribution Reinvestment Plan (DRP). These measures will be in effect until the valuation process concludes and the audited financials for the half-year ending 31 December 2023, are released. It is anticipated that applications and DRP will be reinstated in early 2024 as this process completes.

During the quarter, the Fund implemented new hedging which lifted the hedge ratio to 51.7% against drawn balance, and produced a weighted average hedge term of 1.85 years as at 31 December 2023.

Cromwell remains committed to unlocking property value through proactive asset management, aiming to navigate the cyclical downturns in the commercial property market.

Read more about the Cromwell Direct Property Fund: www.cromwell.com/dpf.

Past performance is not a reliable indicator of future performance.

Cromwell Funds Management Limited ACN 114 782 777 is the responsible entity of and issuer of units in the Cromwell Direct Property Fund ARSN 165 011 905.

Before making an investment decision in relation to the Fund it is important that you read and consider the Product Disclosure Statement and Target Market Determination available from www.cromwell.com/dpf, by calling 1300 268 078 or emailing invest@cromwell.com.au.


  1. Monthly Consumer Price Index Indicator, November 2023 (ABS, Jan-24)
  2. Capital Market Yields – Government Bonds (RBA, Jan-24)
  3. Labour Force, Australia, November 2023 (ABS, Dec-23)
  4. Real Capital Analytics, Jan-24
  5. Retail Trade, Australia, November 2023 (ABS, Jan-24)
  6. Australia’s Industrial and Logistics Vacancy Second Half 2023 (2H23), CBRE (Dec-23)
About Cromwell Direct Property Fund

Read more about Cromwell Direct Property Fund, including where to locate the product disclosure statement (PDS) and target market determination (TMD). Investors should consider the PDS and TMD in deciding whether to acquire, or to continue to hold units in the Fund.

Person typing on a laptop

Learn

Home Archives for brunoconsiglio
January 9, 2024

December 2023 quarter ASX A-REIT market update

Stuart Cartledge, Managing Director, Phoenix Portfolios


Market Commentary

The S&P/ASX 300 A-REIT Accumulation Index moved substantially higher in the final quarter of 2023, gaining 16.5%. Property stocks meaningfully outperformed broader equities in the quarter, with the S&P/ASX 300 Accumulation Index adding a lessor 8.4%. This outperformance was driven by a large move in bond yields. After hitting a peak of approximately 5.0% during the quarter, the 10 Year Australian Government Bond yield dropped materially, finishing below 4.0%.

Property fund managers earnings are particularly leveraged to movements in bond yields. Given this it is unsurprising that they were major outperformers during the quarter. Charter Hall Group (CHC) had previously materially underperformed as bond rates rose, however recovered strongly, gaining 29.2% over the quarter. Centuria Capital Group (CNI) followed a similar path, rising 32.7% for the quarter. Goodman Group (GMG) as only a marginal outperformer for the period, lifting 18.6%, however had performed stronger earlier in 2023, finishing with a total return of 47.5% for the calendar year. In contrast, despite having a productive period from a business development perspective, property debt fund manager Qualitas Limited (QAL) only added 3.1% as its investment products will not directly benefit from a reduction in interest rates.

Those with exposure to residential property, particularly smaller capitalisation securities, were major underperformers across the December quarter. AV Jennings (AVJ) lost 9.1%, propelled lower by a heavily discounted, and somewhat surprising equity raise. Aspen Group (APZ) underperformed the index, only up 1.9%, with Peet Limited (PPC) similarly gaining only 4.5%. Performance was more robust for large capitalisation residential property developer Stockland (SGP), up 15.6%, just below the index’s strong result.

Office property owners had very mixed results during the period. Leading the way higher was GPT Group (GPT) which rose 22.2% for the quarter. Centuria Office REIT (COF) was also an outperformer, recovering some of its recent underperformance, adding 20.2%. On the other side of the ledger, Australian Unity Office Fund (AOF) lost ground in an absolute sense falling 16.2%, whilst Dexus (DXS) gained only 8.9% after announcing current Chief Investment Officer, Ross Du Vernet will take over from Darren Steinberg as Chief Executive Officer of the company in 2024.

Retail landlords were very strong performers to finish off the year. The major outperformer was Unibail-Rodamco-Westfield (URW), who’s share price shot 47.5% higher. As one of the more financially leveraged stocks in the sector, it is a relative beneficiary of lower global interest rates. Scentre Group (SCG) and Vicinity Centres (VCX) were also outperformers, up 21.5% and 20.4% respectively. Both are beneficiaries of more resilient consumer spending than anticipated, with initial indications of spending across the key Christmas period appearing robust.

In general, smaller capitalisation, non-benchmark property owners were substantial underperformers during the quarter. Each of Desane Group Holdings (DGH), 360 Capital REIT (TOT), Newmark Property REIT (NPR) and Gowings Brothers Limited (GOW) had negative absolute returns despite the movement in the Index and bond yields. In many cases this may be more representative of shorter term supply and demand dynamics for shares rather than underlying business underperformance.

Market outlook

The listed property sector is in good shape and provides investors with the opportunity to gain exposure to high quality commercial real estate at a meaningful discount to independently assessed values. While share market volatility may be uncomfortable at times, the offset is liquidity, enabling investors to rebalance portfolios without the risk of being trapped in illiquid vehicles.

Rising interest rates have been a headwind for many asset classes, with property, both listed and unlisted, a particularly interest rate sensitive sector. The August reporting season saw a number of listed stocks come under pressure as short term interest rates hedges are beginning to roll off and higher interest costs are impacting earnings growth and distributions. Long term valuations are driven by “normalised” interest costs, meaning the impact of short term hedges maturing is mostly immaterial. Should the sharp decline in interest rates seen in December 2023 be sustained, these headwinds may dissipate and possibly reverse.

The industrial sub-sector continues to be the most sought after, given the tailwinds of e-commerce growth, the potential onshoring of key manufacturing categories and the decision by many corporates to build some redundancy into supply chains to cope with current disruptions. All of these factors are contributing to ongoing demand for industrial space, which is evident by rapidly accelerating market rents and vacancy rates at historic lows of around 1% in many markets.

We remain cognisant of the structural changes occurring in the retail sector with the growing penetration of online sales and the greater importance of experiential offering inside malls. Recent performance of shopping centre owners has however been strong, with consumers showing resilience. It is interesting to note the juxtaposition of very high retail sales figures despite very low levels of consumer confidence, no doubt impacted by rising costs of living. Importantly, we are also now seeing positive re-leasing spreads in shopping centres, indicating strengthening demand from retail tenants.

The jury is still out on exactly how tenants will use office space moving forward, but demand for good quality well located space remains. Leasing activity is beginning to pick up, and there has also been some transactional activity, albeit at prices typically at discounts to book values. Incentives on new leases do remain elevated and some vacancy in the market is becoming apparent.

We expect to see further downside to asset values in office markets, but elsewhere expect market rent growth to largely offset cap rate expansion, particularly in industrial assets. Listed pricing provides a meaningful buffer to such movements.

About Stuart Cartledge

Stuart is the Managing Director of Phoenix Portfolios and the portfolio manager for each of the company’s property portfolios. Prior to establishing the business in 2006, Stuart built a strong track record in the listed property security asset class and has been actively managing securities portfolios since 1993. Stuart holds a master’s degree in engineering and management from the University of Birmingham and is a Chartered Financial Analyst.

The content above is taken from the Cromwell Phoenix Property Securities Fund quarterly report. Sign up here to be the first to access the latest report and to gain a deeper insight into the Fund’s performance.

Performance commentary

Fill out the form below to view the full commentary.

I'm interested in:

All personal information submitted will be treated in accordance with our Australian Privacy Policy. By submitting personal data to Cromwell Funds Management, you agree that, where it is permitted by law and in accordance with our Australian Privacy Policy or where you have agreed to receive communications from us, Cromwell Funds Management may use this information to notify you of our products and services and seek your feedback on our products and services. Please note you can manually opt out of any communications.

Person typing on a laptop

Learn

Home Archives for brunoconsiglio
January 9, 2024

Build to Rent – an emerging asset class in Australia

Stuart Cartledge, Managing Director, Phoenix Portfolios


SC_mirvac

In October 2023, Phoenix participated in an Investor Day, hosted by listed REIT, Mirvac Group, that focussed on “Living Sectors”. Aside from the joy of wearing a high-vis jacket, those with an eye for detail will notice the badge, clearly indicating that the occupant of the jacket is a “Young Worker”.

In this article we share with you some of the lessons learned by that young worker from the day.

Australia has a housing crisis. We may have had an inkling of this one before the tour, but with an estimated 1,000,000 new immigrants expected to arrive in Australia over the next 3 years, requiring approximately 400,000 dwellings, we’re going to have to get cracking with the government’s new housing targets.

The chart below puts these figures into the context of what has been delivered in the past. The key takeaway for us, is that the Australian Government may well be having another Utopia moment.

With demand likely to remain robust, and rental markets as tight as a drum, the opportunity for an entity such as Mirvac Group to deliver product into this environment is compelling.

Built-to-rent

What is “Build to Rent”?

Build to Rent (BTR) is the creation of residential dwellings, typically apartments, which instead of being strata titled and sold to individuals, remain institutionally owned, professionally managed, and represent high quality rental accommodation, often including a higher level of amenity than competing product. Furthermore, a resident has security of tenure, not just through a lease, but because the entire building forms part of a long-term residential community.

An investor in BTR benefits from typically high occupancy rates, with multiple tenants delivering low volatility of income and stable valuations. Well-designed buildings should certainly benefit from relatively low maintenance capital requirements, at least initially, and certainly do not suffer from the requirement to incentivise tenants with expensive fit outs that plague the office leasing market.

While BTR may be a relatively new concept in Australia, it is a mature property sub-sector in offshore markets, particularly in the US, where it is referred to as “multi-family”.


Mirvac is pioneering BTR in Australia

The BTR sector is embryonic in Australia, representing less than 0.5% of housing stock across the country. This compares with a ~12% penetration in the US and around 5.4% in the UK. The opportunity set is therefore large.

For MGR, the BTR sector capitalises on the company’s 50-year residential track record of asset design and creation and has facilitated MGR to pioneer the sector in Australia. MGR has branded its BTR product with the “LIV” name, and delivered LIV Indigo, its first project in Sydney Olympic Park back in September 2020. That project is now 94% occupied. LIV Munro, opposite Queen Victoria Market in Melbourne’s CBD is the second completed project which opened at the end of last calendar year and is now 70% occupied. LIV Munro is pictured below.

Mirvac-pioneering-BTR-Australia

The tour showed investors around LIV Munro enabling us to get a feel for the amenity, including pool, gym, dining areas, podcasting rooms and rooftop BBQ and relaxation facilities and to meet the on-site staff responsible for the community experience. We were impressed.

We also visited LIV Aston, a project under construction on the corner of Spencer Street and Flinders Street West, also in Melbourne’s CBD. Hard hat required! With a total of 474 apartments, the construction project was on time and budget and is expected to compete before the end of the current financial year. This project is almost adjacent to another, yet to be competed, BTR project currently being developed by Lendlease. It will be interesting to see these projects go head-to-head when they are both operational.

Alongside the three projects referred to above, MGR has another 2 projects under construction, one in Melbourne and the other in Brisbane, which will bring their collective exposure to BTR to approximately 2,200 apartments across 5 projects.

Financial metrics are interesting

Financial modelling for BTR is made a little tricky by some big movements in construction costs over the last few years, which ordinarily would lower returns, combined with some offsetting and also significant market rental increases in the residential sector. For MGR, the end result is a stabilised yield on cost of 4.5% – 5.0%. Along with rental growth, maintenance costs and ancillary income, the investment return (Internal Rate of Return) is estimated to be around 7% – 7.5%.

MGR’s investment in the sector is structured in a joint venture as shown in the diagram below.

External investors sit alongside MGR, and enjoy investment returns that benefit from MGR’s active management and can take comfort that MGR’s interests are very much aligned with theirs.

In addition to the returns on capital invested in the joint venture, MGR also earns funds management, development management and asset management fees across the platform. This fee stream is more volatile but adds to the returns that MGR shareholders enjoy.

Mirvac-summary_btr

Phoenix assumes that MGR is able to build out its current pipeline of BTR opportunities and will be able to identify future projects to reach its medium term target of 5,000 apartments on the platform. Importantly, we also assume that the company will be able to continue to partner with external investors to deliver a solid outcome for all stakeholders.

We expect the BTR market to get more competitive, but with penetration rates so low and the demand for housing so high, we forecast a solid runway for the foreseeable future. The only sad thing about the day, was the discovery that BTR is typically targeting the affluent renters, aged between 25 and 39. The “young worker” on this tour is more likely a target for the over 55 land lease portfolio, which we will write about in subsequent articles.

About Stuart Cartledge

Stuart is the Managing Director of Phoenix Portfolios and the portfolio manager for each of the company’s property portfolios. Prior to establishing the business in 2006, Stuart built a strong track record in the listed property security asset class and has been actively managing securities portfolios since 1993. Stuart holds a master’s degree in engineering and management from the University of Birmingham and is a Chartered Financial Analyst.

The content above is taken from the Cromwell Phoenix Property Securities Fund quarterly report. Sign up here to be the first to access the latest report and to gain a deeper insight into the Fund’s performance.

Performance commentary

Fill out the form below to view the full commentary.

This field is hidden when viewing the form
I am a
I am interested in:

All personal information submitted will be treated in accordance with our Australian Privacy Policy. By submitting personal data to Cromwell Funds Management, you agree that, where it is permitted by law and in accordance with our Australian Privacy Policy or where you have agreed to receive communications from us, Cromwell Funds Management may use this information to notify you of our products and services and seek your feedback on our products and services. Please note you can manually opt out of any communications.