

42434
Person typing on a laptop

Learn

Home June 2026 direct property market update
July 21, 2026

June 2026 direct property market update

Economy

Since last quarter’s update, the economic backdrop has remained constrained and heavily influenced by geopolitical developments. While the signing of a ceasefire agreement between the US and Iran provided a pathway to conflict resolution and led to fuel prices falling to their lowest levels since early March1, recent escalation of tensions has renewed concerns about global energy markets and supply chains. The risk of further disruptions has increased uncertainty for households, businesses, and policymakers, with the ultimate economic impact dependent on the duration of the conflict and the degree to which shipping volumes through the Strait of Hormuz normalise.

Against that backdrop, the domestic inflation picture remains mixed. Headline inflation eased to 4.0% in May from 4.2% in April, helped by lower fuel prices. However, underlying inflation moved the other way, with trimmed mean inflation rising to 3.6% from 3.4%2.

The RBA responded to persistent underlying inflation pressures by raising the cash rate a further +25bps in May to 4.35%, before leaving rates unchanged in June. The Board noted that financial conditions are now restrictive and that earlier rate rises are starting to affect the economy, including housing market momentum. But it also noted that inflation remains materially above target and the cash rate may be increased further if needed3. A slight majority of economists polled in the AFR’s latest quarterly survey expect no further hikes this year4, broadly consistent with financial market pricing5.

Activity indicators are now softer. Data released in June showed that Australian GDP rose by only 0.3% in the March quarter6, and consumer sentiment7 and business confidence remain deeply pessimistic8.

One important offset has been the strength of AI-related investment. The RBA noted that growth across Australia’s major trading partners has been supported by technology and AI-related spending9, while in Australia, data centre investment is making a meaningful contribution to private business investment10. This is a positive tailwind for activity, but it also creates pressure points, particularly around electricity infrastructure and construction capacity in other sectors. The labour market remains another source of support, with employment rising in May and unemployment easing to 4.4%11.

Overall, the economy remains constrained, with resilient labour market conditions and AI-related investment providing support, while inflation and heightened geopolitical uncertainty continue to cloud the outlook.
“Data released in June showed that Australian GDP rose by only 0.3% in the March quarter6, and consumer sentiment7 and business confidence remain deeply pessimistic8.”

Office12

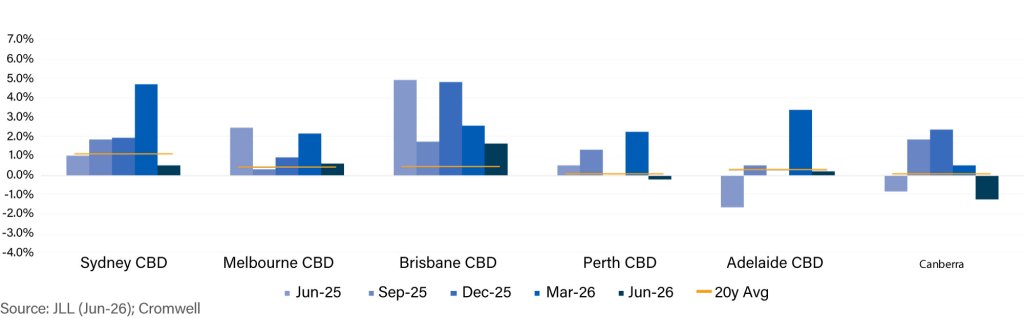
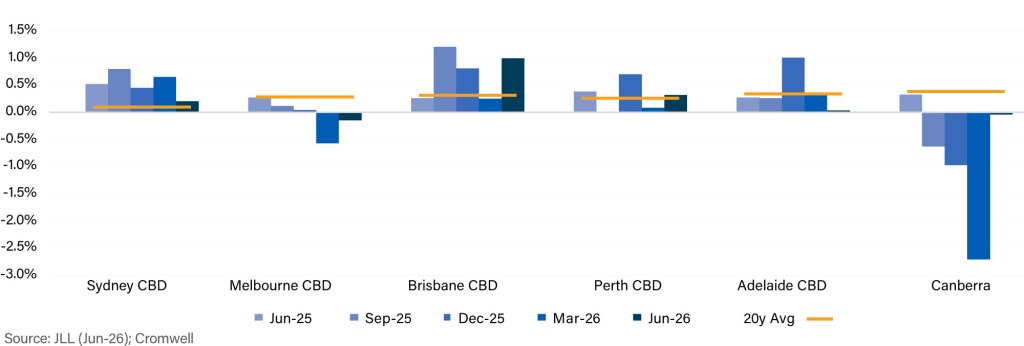
It was a solid quarter for net space demand across the major CBD markets. Brisbane CBD was the top-performing market for the first time since Q4 2024, recording nearly 21,000 square metres (sqm) of net absorption. The strong quarter was underpinned by small tenant (<1,000 sqm) net expansion of over 17,000 sqm. Sydney CBD delivered its tenth consecutive quarter of positive demand, in part due to some inbound relocations from non-CBD markets, which contracted. Melbourne CBD was the weakest performer over the three months to June, with occupied stock contracting by just over 6,000 sqm. In aggregate, occupied stock increased by nearly 29,000 sqm across the major CBD markets, a significant improvement on last quarter’s 38,000 sqm contraction.

Net Absorption QoQ (%)


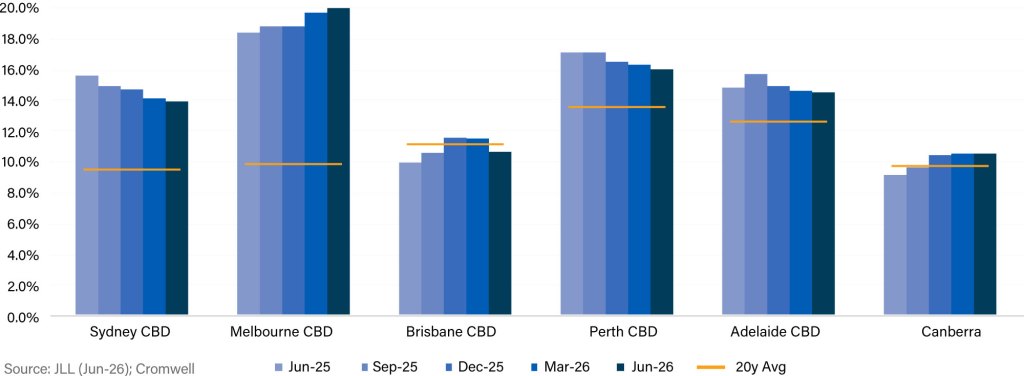
The national CBD vacancy rate nudged +0.1ppts higher, however the underlying movements were largely positive. Like last quarter, the increase was almost entirely driven by Melbourne CBD, which recorded a vacancy rate increase of +0.8ppts. The deterioration was relatively broad-based, with every precinct except Flagstaff weakening, however vacancy at the Premium end of the market did decrease. Every other market saw vacancy decrease or remain largely flat on last quarter. Brisbane CBD saw the most pronounced tightening in conditions and its vacancy rate now sits below the long-term average.


Total Vacancy Rate


National CBD prime net face rent growth of +0.5% was recorded over the quarter. This was the first quarter of sub-1% growth since late 2023, however the annual pace of growth remained a very healthy +5.5%. While the pace of growth decelerated, every major CBD market recorded a positive result. Brisbane CBD was again the top-performer, reflecting favourable space market conditions. Prime incentives were relatively unchanged over the quarter, meaning changes in effective rents were largely driven by the headline growth rates.


Prime Net Effective Rental Growth QoQ


National office transaction volume picked up over the quarter despite lingering geopolitical uncertainty. Nearly $2.3b of office assets changed hands nationally, with the major CBD markets accounting for over $1.6b. On a rolling four-quarter basis, national transaction volume is now at its highest level since the post-pandemic rate hike cycle impacted liquidity.

Sydney CBD was the dominant market over the quarter, representing over half of national dollar volume. The strong result was headlined by Charter Hall taking control of the O’Connell precinct. Transaction volume was also elevated in Brisbane Fringe, reflecting activity south of the river.

Prime average equivalent yields expanded by 12.5bps in Canberra and 25bps in Perth CBD but were unchanged across the other major CBD markets.

“On a rolling four-quarter basis, national transaction volume is now at its highest level since the post-pandemic rate hike cycle impacted liquidity.”

Retail12

Retail spending has remained resilient despite ongoing cost-of-living and interest rate pressures. Annual nominal retail turnover growth accelerated from 5.3% in April to 5.8% in May, supported by stronger spending across groceries and dining. While household budgets remain under pressure, consumers have maintained their spending habits by tapping into savings buffers.

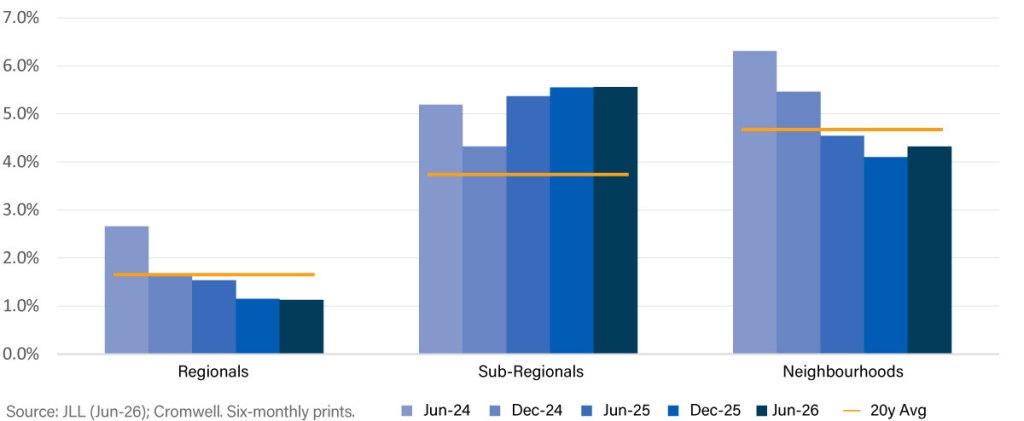
Resilience in consumer spending continues to support retail property fundamentals. Vacancy rates remain historically tight across most centre types, reflecting a combination of stable occupier demand and limited new supply. Regional shopping centre vacancy decreased by 0.1ppts, reaching its tightest level since 2014. Neighbourhood centres remain well occupied despite a modest increase in vacancy, while conditions across Sub-Regional centres were broadly unchanged at an aggregate level.

Retail Specialties Vacancy Rate 

Retail Specialties Vacancy Rate

It was a mixed quarter for net rent growth. Regional rents saw notable falls in Perth (-1.9ppts) and South East Queensland (-1.1ppts) but recorded modest growth across the other markets. Sub-Regional rents were largely unchanged, with modest growth recorded in South East Queensland and Melbourne. Growth was more broad-based across Neighbourhood shopping centres, with rents increasing by 0.1-0.7ppts in every market except Perth. Regional shopping centres are still the top-performing on an annual basis, but the pace of rent growth across centre types is converging.

Investor activity strengthened considerably during the quarter, with retail transaction volume approaching $3.4b. It was the second-strongest June quarter on record13, exceeded only by Q2 2025. The result was driven by the big end of town, as 50% stakes in two Regional shopping centres were acquired by GPT (from Lendlease) for $1.2b, and JY Group acquired 50% of Westfield Marion for $670m. This was the ninth consecutive quarter a Regional transaction has occurred, marking the longest streak in the history of the data series. It was also a quarter of elevated activity across non-core centre types, with over $400m of outlet centres transacting.

Average equivalent yields were unchanged across every market and centre type.

Industrial12

Industrial occupier gross demand was robust over the quarter, with take-up totalling nearly 1.2 million sqm, representing the fourth-strongest quarter on record. Activity was underpinned by exceptionally strong Manufacturing demand, which reached a record high in both leased area and number of leasing deals. While Manufacturing demand was broad-based, it was particularly strong in Adelaide on a relative basis. From a geographical perspective, Melbourne recorded the most overall demand on an absolute basis, while Adelaide was the top-performer on a percentage basis relative to trend.

Less than 600,000 sqm of supply was delivered over the quarter, around 10% below the average quarterly rate of completions over the last five years. Brisbane accounted for the largest share of new supply, driven by the two largest developments of the quarter (both in the Southern precinct). Supply was also elevated in Adelaide, specifically the northern precincts. The future supply pipeline continues to moderate as feasibility pressures constrain project commencements. Projects already underway are facing labour shortages and some of the supply earmarked for completion this year is likely to be delayed to 2027.

Robust demand and lack of supply had a positive influence on the national industrial vacancy rate, which declined slightly to 4.8%. Brisbane and Adelaide saw the biggest improvement, however Perth remained the tightest market nationally with a vacancy rate of just over 2%.

Prime net rent growth was consistent with last quarter, averaging 1.2% nationally over Q2 2026. Adelaide continued to be one of the top-performing markets with two of its precincts taking the gold and silver medal positions. Perth was the strongest performer overall with average quarterly growth of 3.5%, but continues to lag on an annual basis due to limited growth over earlier quarters. Prime incentives increased slightly along the East Coast, particularly in Brisbane, widening the rent growth outperformance of Adelaide and Perth on an effective basis.

Industrial transaction volume surged above $4b for the quarter, the strongest outcome recorded since 2021. The result was underpinned by a consortium’s $1.5b acquisition of the Moorabbin Airport precinct, but activity was well rounded with every market except Brisbane exceeding its average five-year quarterly volume. While Melbourne dollar volume was supported by the Moorabbin transaction, the number of deals completed continues to lag historical averages.

Average prime yields were unchanged across every market.

Outlook

The macroeconomic outlook remains uncertain. While resilient employment growth and AI-related investment continue to support activity, inflation remains above target and geopolitical tensions have increased uncertainty around the growth and interest rate outlooks. Volatility is therefore likely to remain elevated as domestic and global markets respond to evolving economic and geopolitical developments.

For direct property markets, the more important medium-term consideration remains the balance between supply and demand. Development feasibility continues to be challenged by elevated construction costs, financing costs, and labour constraints, limiting the volume of new projects proceeding to construction. The US-Iran conflict has reinforced these pressures through higher input costs and renewed supply chain disruption. As a result, supply pipelines across most sectors remain constrained, supporting the rental growth and valuation outlook for well-located existing assets.

Demand conditions are likely to become increasingly differentiated across sectors and markets. A potentially weaker economic environment could create headwinds for occupier demand, however the Australian market enters this period from a position of relative strength, supported by a resilient labour market, strong population growth and ongoing business investment.

We expect greater divergence in performance across property sectors, markets, and individual assets. In a more uncertain macroeconomic environment, resilience is likely to be increasingly determined by supply conditions, tenant quality, and income security. Asset selection and active management will therefore become more important drivers of investment outcomes.

Footnotes

  1.  Oil Market Report, IEA (17th June 2026)
  2. Consumer Price Index, ABS (24th June 2026)
  3. Statement by the Monetary Policy Board: Monetary Policy Decision, RBA (16th June 2026)
  4. No rate cuts until 2027 as a fourth rise looms, say economists, AFR/G. Lagan (6th July 2026)
  5. RBA Rate Tracker, ASX (3rd July 2026)
  6. Australian National Accounts, ABS (3rd June 2026)
  7. Consumer Sentiment Index, Westpac/Melbourne Institute (9th June 2026)
  8. Quarterly Business Survey, NAB (25th June 2026)
  9. Statement on Monetary Policy, RBA (5th May 2026)
  10. Data centre investment drives new capital expenditure, ABS (28th May 2026)
  11. Labour Force, ABS (25th June 2026)
  12. Cromwell analysis of JLL data (Jun-26)
  13. Data series commences in 2007


Important Notice

This correspondence has been prepared by Cromwell Funds Management Limited ABN 63 114 782 777 AFSL 333214 (CFM), Cromwell Real Estate Partners Limited ABN 23 152 674 792 AFSL 418476 (CREP) and Cromwell Property Securities Limited ABN 11 079 147 809 AFSL 238052 (CPSL), all of which are wholly owned subsidiaries of Cromwell Corporation Limited ABN 44 001 056 980.  Cromwell Property Group comprises Cromwell Corporation Limited ABN 44 001 056 980 and Cromwell Diversified Property Trust ARSN 102 982 598, the responsible entity of which is CPSL.

This correspondence is not intended to provide investment or financial advice or to act as any sort of offer or disclosure document. It has been prepared without taking into account any investor’s objectives, financial situation or needs. It is provided for general information purposes only. Any potential investor should make their own independent enquiries, and talk to their professional advisers, before making investment decisions.  In making an investment decision in relation to any fund, it is important that you read the disclosure documents issued by that fund. The disclosure documents for the funds are available from www.cromwell.com.au or by calling Cromwell’s Investor Services Team on 1300 268 078.

None of CFM, CREP, CPSL or its related bodies corporate or their respective officers, employees, agents or advisors (Cromwell Property Group Members) make any representation or warranty, express or implied, as to the accuracy, completeness, timeliness or reliability of the contents of this webpage. To the maximum extent permitted by law, none of the Cromwell Property Group Members accept any liability (including, without limitation, any liability arising from fault or negligence) for any loss, damage, cost or expense whatsoever arising from the reliance on or use of this webpage or its contents or otherwise arising in connection with it.

This webpage may contain forward-looking statements, guidance, forecasts, estimates, prospects, intentions, projections or statements in relation to future matters (Forward Statements). Forward Statements can generally be identified by the use of forward looking words such as anticipate, estimates, will, should, could, may, expects, plans, forecast, target or similar expressions. Forward Statements including indications, guidance or outlook on future revenues, distributions or financial position and performance or return or growth in underlying investments are provided as a general guide only and should not be relied upon as an indication or guarantee of future performance. Forward Statements are subject to known and unknown risks, uncertainties, contingencies and other factors which may cause actual results, performance or achievements to differ materially from those expressed or implied by the Forward Statements. No independent third party has reviewed the reasonableness of any such statements or assumptions. None of the Cromwell Property Group Members represent or warrant, assure or guarantee that such Forward Statements will be achieved or will prove to be correct or gives any warranty, express or implied, as to the accuracy, completeness, likelihood of achievement or reasonableness of any Forward Statement contained in this webpage. Cromwell Property Group Members assume no obligation to release updates or revisions to Forward Statements made as of the date of this webpage to reflect any changes that occur after the date of this webpage. Past performance is not a guarantee of future performance.

The distribution and use of this webpage, including any related advertisement or other offering material, in jurisdictions outside of Australia may be restricted by law and any person who resides outside Australia or who receives this webpage outside of Australia should seek advice about it and observe any applicable legal restrictions.

CFM, CREP and CPSL do not receive any fees for the general advice given in this correspondence.